
This month, we dive into some topics we’ve touched on recently – the economic and fiscal impacts of inclusionary zoning; social and political sorting; and agglomeration effects in the economy. This month’s grab-bag of analysis isn’t really a random assortment of observations so much as a group of related items, but it is still flotsam and jetsam. Let’s dig in…
ECONOMIC & FISCAL IMPACTS OF INCLUSIONARY ZONING
A couple of weeks ago, I wrote a think piece about the economics of taxing and spending. One argument that I made in that piece is that the MPDU program is a kind of borrowing from the future – i.e., that affordable housing set-asides function as a way of borrowing from the future economic and revenue-generating capacity of the county’s land – which is essentially MoCo’s “natural resource” – to meet current local and regional demand for affordable housing. In the piece, I acknowledged that there may be a moral obligation to address affordable housing needs; but I also argued that there is a limit to how much the county can afford to do in that regard, and that this is true regardless of whether the county is direct spending or spending via land use exactions (i.e., spending by requiring developers to provide affordable units).
Some regional housing market context…
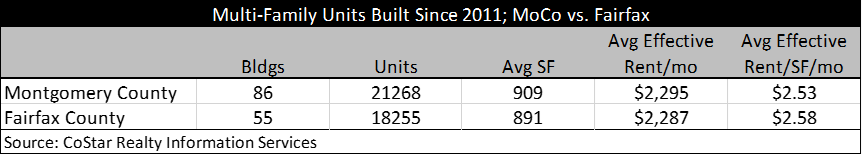
As you can see, MoCo has added more multi-family units than Fairfax, and the MF rents in these two counties are comparable. Given the economics of verticality, I also added a narrower search that only includes high-rise buildings.
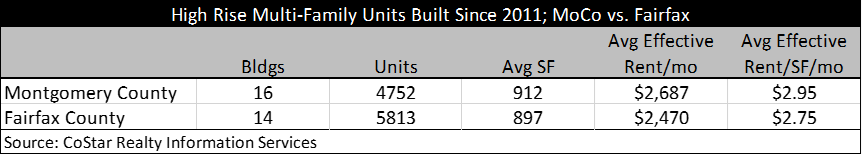
While MoCo has seen more overall MF development than Fairfax, there has been less high-rise MF development in MoCo. You can see from the last two tables that rents start off similar but diverge when we limit the search to high-rise. I’ll come back to this later – and while you might be curious, trust me when I say this isn’t the most interesting thread to pull on this topic.
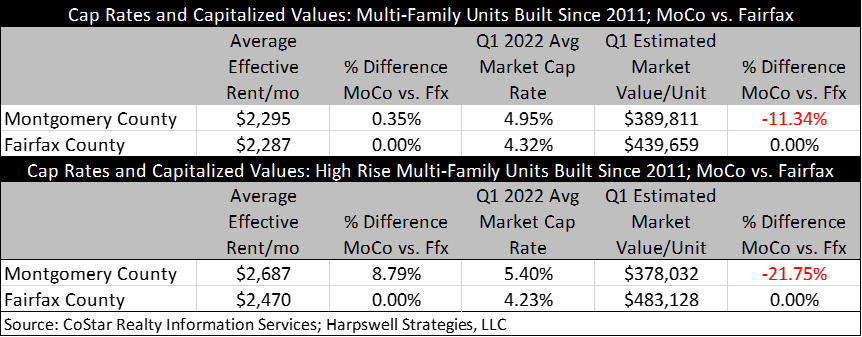
Despite the fact that average rents are somewhere between “equal” and “higher in MoCo,” the difference in per unit market value is substantial. What a higher cap rates tells us is that the market is willing to pay less for the same dollar of net operating income (NOI), which is how we end up seeing that the average MoCo high-rise unit has an effective rent nearly that is 9% above its Fairfax counterpart…but is worth, on average, nearly 22% less per unit. Ouch. The cap rate divergence also implies that the market’s expectations are that the future NOI in MoCo will be below current levels, either because of new government requirements that will increase operating costs, or future government limits on rental revenue.
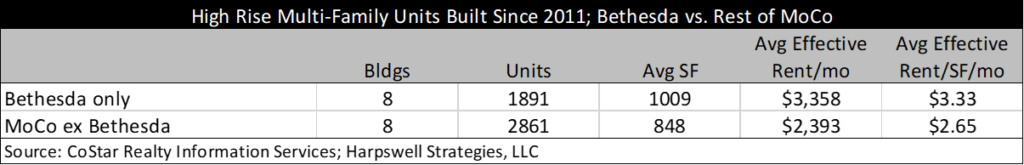
The more the county focuses future growth around transit-served nodes, the more pressure there is to go up, up, up. And that works economically in Bethesda in a way that it does not in other locations in the county. The market will pay Bethesda rents in Bethesda, but it won’t pay Bethesda rents anywhere else. And without Bethesda rents, it is difficult to make vertical development work; this is particularly problematic on certain types of sites, like Metro station properties and other sites that have been specifically identified in master plans as suitable for signature or gateway buildings, and where height is explicitly encouraged. First, let’s peek at the recent high rise multi-family apartment buildings.
Here are the buildings themselves, using CoStar’s definition of high rise (15 stories +).
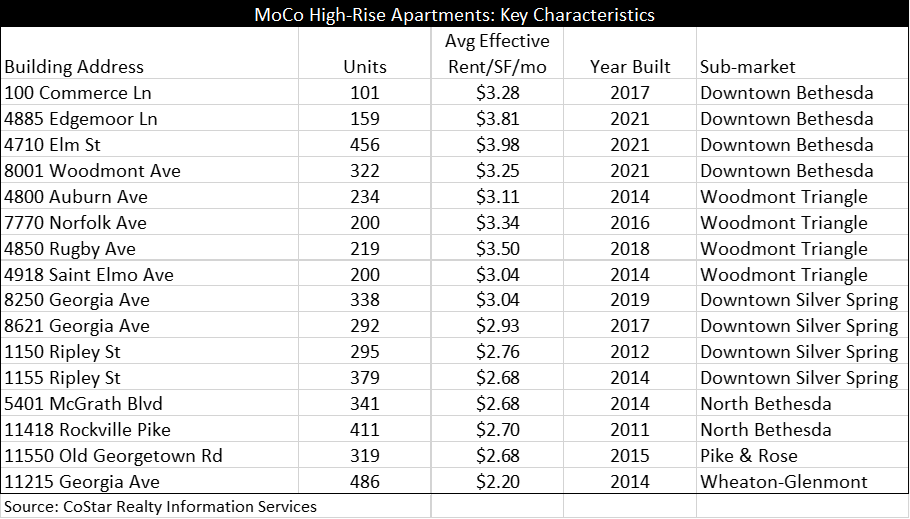
If you are counting, that is 8 buildings in Bethesda, 3 in North Bethesda/Pike & Rose, and then 5 in Enterprise Zones (Silver Spring and Wheaton). The North Bethesda/Pike & Rose high-rise apartments were built in the 2011 to 2015 period, with none built after the MPDU requirement in that part of the county increased from 12.5% to 15.0%. All buildings outside of downtown Bethesda and Woodmont Triangle were subsidized in some fashion or other (no impact taxes, no impact taxes plus property tax abatement and income tax credits, low-interest HIF loan, etc.) and were subject only to the 12.5% MPDU requirement.
Looking at recent vintage apartment buildings of the 8-to-14 story variety provides some more context.
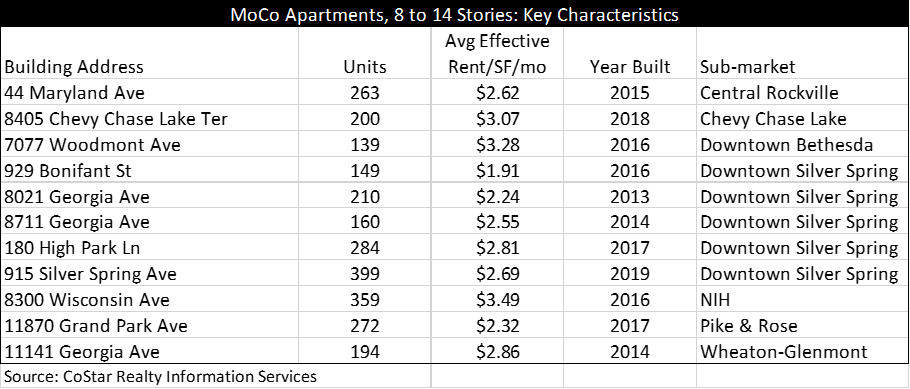
Again, what we are seeing is some greater Bethesda (3 total between downtown, NIH, and Chevy Chase Lake), one Rockville, one Pike & Rose, one Wheaton, and 5 buildings in the Silver Spring CBD. There are also a lot of subsidies in here (Enterprise Zone benefits, impact tax exemptions, subsidies for affordable housing, etc.). And there also is only 1 building on this list that was built after 2018 and it was not in a location in which developments are required to provide 15% MPDU.
Small sample size alert and all of that…but it bears watching because the market seems to be signaling that Bethesda and its immediate environs might work with 15% MPDU and vertical construction, but that by the time you get to North Bethesda the vertical + 15% has become challenging, and the vertical + 12.5% MPDU is challenging in other submarkets in the absence of local subsidies.
Connecting the economic dots to the fiscal dots… Reminder: property tax assessments are based on an income capitalization approach as well. The effects of MoCo’s significant affordable housing set-asides and uniquely long “control period” (99 years!) are not only downward pressure on values, but also downward pressure on property tax revenue. This is what I meant recently when I noted that MoCo’s very well-intentioned affordable housing set-aside program is a form of borrowing against future economic value and county tax revenue to achieve a current social policy objective.
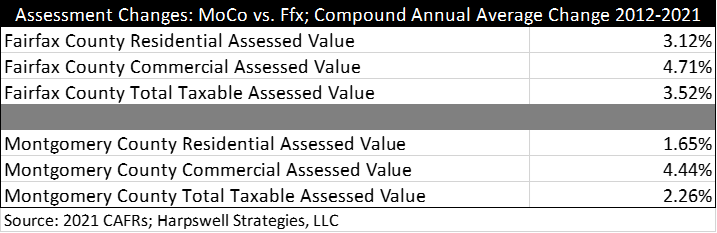
MoCo’s population growth has outpaced Fairfax in recent years, with a compound annual average growth rate of 0.66% versus 0.48% in Fairfax, and MoCo has added more new multi-family units than Fairfax. But as you can see, MoCo assessments are increasing at a much slower pace. I recently estimated that if Fairfax assessed values had grown at the pace of MoCo assessed values, Fairfax would have $285 million less in ANNUAL property tax revenue. So, the impact of MoCo’s land use regulation is greater than zero by around $285 million per year.
Returning to the market values of multi-family units, earlier we established that there are more than 20,000 relatively new multi-family rental units in MoCo, and that (on average) they are worth about $50,000 less per unit than similar units in Fairfax. That difference in economic value translates into more than $1 billion in foregone assessed value, which equates to more than $10 million per year in foregone annual property tax revenue…Again, that $10 million is just from these new multi-family rental units; based on a back-of-the-envelope estimate, these units represent a total of about 3.5% to 4.0% of the assessed value of MoCo real property, so you can imagine that the overall impact on assessed value of MoCo real property is…really big…
What we could know about this issue if we just slowed down…
Let’s set the way back machine to July 2017. RKG’s Montgomery County Rental Housing Study outlined the implications of inclusionary zoning alternatives (IZ) on capitalized values. If you are interested in reading this section for yourself, check out the technical appendix starting at page 159, but here is a key excerpt:
“[C]hanging the percentage of affordability requirement has a substantial impact on the financial performance of the property. Adjusting from 12.5 percent to 15 percent creates a net value loss… Since costs, revenues and profit requirements generally are fixed when making a go/no go decision, this loss of value on the project will manifest in a lower voluntary contribution to other public benefits or a reduction in the value of the land. Based on average land values in this subarea, the change in policy by 2.5 percent in requirement will cost between 12 percent and 25 percent of value for the land holder.”
The following page of the report helps illustrate as well. RKG’s analysis indicates that going from 12.5% to 15% MPDU in the Friendship Heights/Bethesda/North Bethesda area results in a loss of 23.8% of value; and a little extra math illustrates the further impact of the “deep affordability” requirement in Bill 29-20 (establishing a tax abatement for high rise residential projects on WMATA owned land) – the additional hit to land value of requiring 25% of those MPDU to be affordable to folks at or below 50% of Area Median Income is a loss of an additional 6.9% of value. Add it all up and 30.7% of the value of the project is lost to due to the extra costs of going from 12.5% to 15% MPDU and requiring that 25% of total MPDU are deeply affordable. In case you are wondering, a 30.7% hit to value is a lot more than it takes to move a complicated vertical project from “go” to “no go.”
As a brief aside, it was interesting to review a recent report by JLL, completed for Montgomery County, regarding development feasibility of the remaining WMATA-owned parcels at White Flint Metro Station. JLL concludes that, at the White Flint Metro Station, the cost of the MPDU and deeply affordable units is not offset by the value of the property tax abatement for which high-rise residential rental developments on WMATA owned land are eligible…Anyhoo…back to the topic at hand…
A final note here, looking back at the fiscal and economic impact statements on Bill 38-17, which increased the MPDU requirement from 12.5% to 15% in certain locations, there is no mention of the RKG report or acknowledgment of its findings. For example, here is what the economic impact statement has to say:
“The Bill’s positive or negative effect, if any, on employment, spending, savings, investment, incomes, and property values in the County: Bill 38-17 would have a positive effect on the number of MPDUs for sale and rent for those families seeking affordable housing…The increases in percentages in Bill 38-17 would increase supply of affordable housing in the County and provide an economic benefit to those families.”
OK, then…But what about the effect on “employment, spending, savings, investment, incomes, and property values”?!? And does someone need to explain that having a higher percentage on paper is not the same as increasing the supply of affordable housing? Put differently, 15% of zero is less than 12.5% of something…everywhere outside of a couple of buildings in Rockville…
The fiscal impact statement isn’t any more helpful, as you can see below.
“Revenue and expenditure estimates covering at least the next 6 fiscal years: There is no estimated change to County revenues…”
The problem wasn’t really that there wasn’t enough information to inform policy – there was plenty of info. Rather, the problem was not enough time or incentive to synthesize and analyze that information. This is a theme I will come back to from time to time this spring, because the curse of being a “charter county” is that the county can take on so many issues, and does, that many of those issues are addressed hastily when addressing them cautiously would have been the more prudent course of action.
For those who might be interested in learning more, this Urban Land Institute paper, The Economics of Inclusionary Zoning, is a good read that touches on the importance of a strong housing market, the need to adapt, levels of subsidies, the effect of high-rise construction costs on development feasibility, and the size/shape of the affordable housing set-asides.
Also, I was reminded that I touched on this topic last summer as well. I’ll stick an excerpt in here so you don’t need to go hunting for it, but it includes some stats that were highlighted in yet another housing report.
Here are some facts from the 2018 Housing Needs Study:
- Since 2010, the County captured only 5% of the household growth in the region.
- 1 out of 2 new households in the County is making less than $50,000/year
- In 2018, 17% of low-income households in the region live in Montgomery County (trailing only the District and Prince George’s County).
- More incredibly, from 2010 to 2018 the County captured 20% of the net new low-income households in the region, beating out all of the competition.
Capturing 5% of household growth but a whopping 20% of new low-income households does not sound like a healthy balance. And not only does this taxpayer funded information and analysis exist, but it isn’t clear that having this information has really helped any of the county’s policymaking institutions guide elected leaders to better decision making on issues at the intersection of housing, the economy, and MoCo’s fiscal health.
A THEORETICAL FRAMEWORK FOR UNDERSTANDING HOUSEHOLD AND FIRM LOCATION DECISIONS
The relationship between local taxes, local spending, and the location decisions made by households and firms has a theoretical grounding. Urban and regional economics nerds (like me) can talk about stuff like this for hours, but for most folks this high-level treatment will suffice.
There are two primary models for thinking about how these decisions are made. The two models aren’t competing with one another for intellectual support – most folks who think about urban and regional economics understand & respect the strengths and limitations of each. Rather, it is more appropriate to think about urban and regional economies as being shaped by a constant push and pull of the two – they are inherently in conflict in the real world and that conflict affects how locations change (economically and socially) over time.
- Sorting: Individuals and firms “sort,” (or “vote with their feet”) based on their respective preferences for services and tax burdens. Part of what we talk about when discussing “persistent poverty,” is that some folks choose to relocate or disinvest based on whether the tax burdens are too high or whether the profile of services provided by their local government is either greater than (e.g., high taxes to support local anti-poverty programs) or less than (e.g., low quality K-12 public education or not enough public safety protection) their preference. This is an especially powerful force in more suburban and exurban locations.
- Agglomeration: Individuals/households and firms place a value on proximity to one another. This value is reflected in the fact that those individuals and firms are willing to pay a premium (e.g., in terms of land costs) to choose their neighbors. An individual or household might be willing to pay a premium to locate near employment opportunities. A firm might be willing to pay a premium to locate near similar firms, firms in its supply chain, or near the residential locations of workers with the requisite skill set. This is an especially powerful force in more urban or central locations.
The conflict between these two models is inherent. If individuals/households and firms sort based on their public policy preferences, then the economic efficiencies associated with agglomeration effects can be lost. On the other hand, if individuals/households and firms agglomerate based on their economic interests, then the social and political efficiencies of sorting can be lost.
MoCo, as an inner-ring suburb, is shaped by this constant push and pull. As a charter county, MoCo is free to pursue a range of local public policies, many of which are the sorts of policies that only a subset of the population is willing to knowingly pay taxes to support – and those that don’t sometimes choose to relocate to some other lower-tax jurisdiction if the cost of doing so is low enough to them.
On the other hand, MoCo is a major employment center with a knowledge-based economy; as such, MoCo needs the economic efficiencies of having clusters of firms co-locating within its borders that will be supplied by a qualified workforce. If people and firms begin to sort based on their policy preferences and tolerance for high taxes, then the economic advantages of proximity will be lost – for example, a firm in the financial services industry is more willing to pay to locate in a county with a deep labor pool of qualified financial services workers than it is to want to pay to live in a county with a shallow pool of socially/politically homogenous workers. At the same time, it is easier to build a social/political coalition that supports a set of public policies where there is no agglomeration effect drawing people and firms with different beliefs.
This may also be what we are seeing in some of the housing economics outlined above – the typical suburban approach of putting up regulatory barriers to development does serve some “sorting” purposes, but it is really hurting us on the “agglomeration” front. Without a growing supply of market rate housing for skilled workers, it is no wonder that the county is becoming less attractive as a location for firms in knowledge-based industries. On the other hand, if your political coalition is progressive NIMBYs, then this kind of sorting is probably what you had in mind all along.
In the end, it may be worth considering whether MoCo has arrived at an imbalance between the two forces. There certainly seems to be a strong political coalition pushing the county socially and politically to the left, and as I have documented here many times (including very recently) the economy is underperforming in ways that indicate that it is no longer functioning at full capacity.
I am nerdy enough that I keep binders filled with 3-hole punched articles and research papers on topics of interest. Below are a few that relate to these theories of spatial economics.
- Academics have been studying this idea of sorting ever since Charles Tiebout published his famous essay, A Pure Theory of Local Expenditures. While a lot of work has been done to refine the theory post-1956, this is the source material and is worth a read for those who are economically inclined.
- This literature review on agglomeration economics is a handy resource for those who are interested in getting in deeper.
- This law review article by David Schleicher has influenced my thinking over the years. For those who are inclined to enjoy academic writing, this one is worth bookmarking. His explanation of the theories and how they operate in a multi-jurisdictional economic region is “spot on,” and that makes this worth reading from an economic perspective even if you don’t care about (or care for) the “law and economics” angle.
- There are some good nuggets in the article that are directly on point. For example: “…[A] local government law regime that encourages sorting will cause development to be less dense and housing to be more expensive. This will have negative effect on all sources of agglomerative efficiency, which derive from interactions between physically proximate individuals and business…”
- This quote says a lot about the relationship between MoCo and the State of Maryland: “As political entities, state governments are often quite concerned with balancing growth across a state and taking economic gains from efficient regions and redistributing them to other parts of the state. George Washington Plunkitt, the famous bard of New York’s Tammany Hall political machine, explained New York State’s relationship with New York City: ‘New York City is pie for the hayseeds.’”
- If you prefer a long-form treatment of “Tiebout sorting,” William Fischel’s book, The Homevoter Hypothesis, is worth a read.
- Regarding the connection between sorting and affordable housing programs, one piece that offers some food for thought is this 2015 dissertation, Trapped in the Tiebout Model: The Impact of Federal Affordable Housing Programs on Migration of Wealthier Residents. It is data heavy, but it is “on point” in terms of this discussion.
WRAPPING UP
In MoCo, inclusionary zoning is an article of faith. But unconditional support for increasing IZ requirements shouldn’t be a litmus test for local political candidates or elected officials because the reality is that the issue is much more complicated than, say, what percentage ends up in a bill, and fixing the county’s economy may require re-balancing the county’s housing policies to promote more market rate housing development. That kind of important policy work really should be informed by analysis rather than emotional appeals and demagoguery. In any event, we can always try…