In this edition we (1) examine Class A office values and cap rates; (2) review the 4th quarter 2021 Quarterly Census of Employment and Wages and what they say about the state of Mo Co’s economy overall and some specific industries; (3) check in on the 2018 County Business Patterns and non-employer statistics and what they tell us about the size of county businesses and the industries with high concentrations of self-employment; (4) look at the nativity and citizenship of DC area business owners; and (5) reflect on Frederick Douglass’ What, to the slave, is the 4th of July?
HEADLINE NUMBERS
Class A office properties across the Washington, D.C. region have actually increased in value relative to one year ago, from $409/square foot to $417/square foot, an increase of 2.0% (per CoStar Analytics).
One subset of those properties – the Class A office properties in Montgomery County – have actually decreased in value from $302/square foot to $292/square foot (a decline of 3.4%), meaning that the increase in values for the rest of the region is actually well above the 2.0% increase experienced by the entire region.
For the region as a whole, the increase in values has occurred at the same time that estimated cap rates for Class A office properties have increased modestly from 6.83% to 6.88%. In the meantime, estimated cap rates for Mo Co Class A office properties have gone from 7.73% to 7.95%, a much larger increase. As a reminder, an increase in cap rates is a bad thing in the context of the value of the property, which matters both to the owners and to the County because the County receives a substantial portion of its revenue from property taxes that are based on capitalized value. A cap rate is Net Operating Income divided by price, sort of like the inverse of a “price-to-earnings ratio,” and an increase in the cap rate means essentially that each dollar of income generated by the property is worth less on the market.
To put this in perspective, here is what those cap rates would mean for the value of a property that generates a net operating income of $1,000,000:
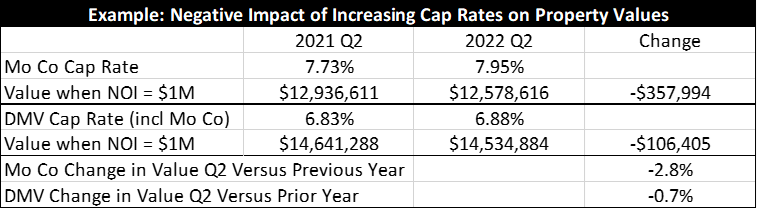
Let’s tie this back to the values per square foot above: if Mo Co Class A office properties are now estimated to be 3.4% less valuable per square foot (from $302 down to $292) while cap rates have only increased by 2.8%, then this means that net operating incomes for these Mo Co office properties have decreased over the past year. In contrast, per square foot Class A office property values for the region (including Mo Co) have increased in value (from $409 to $417) despite the fact that cap rates have risen; this means that net operating incomes at Class A office properties for the region as a whole have not only increased, but they have increased enough to more than offset the modest increases in estimated cap rates.
Succinctly, the market does not (overall) have a favorable view of Mo Co’s mix of properties, property types, tenant industries, achievable rents, employment growth, and operating costs. Over time, the impact of this is felt in assessed property values that do not grow very much, putting pressure on other sources of local revenue. Since no powerful political constituency in Mo Co is pushing for less spending, over time the result will be either new taxes or higher tax rates (or both!).
QUARTERLY CENSUS OF EMPLOYMENT AND WAGES
I’m still digging my way through the recently released QCEW numbers for 4Q2021 in search of insights into the Mo Co economy. As I noted recently in summarizing the top-line numbers, the County actually lost both business establishments and employees at those establishments over the 2019-2021 period. I think the calculations below provide a sense of scale.
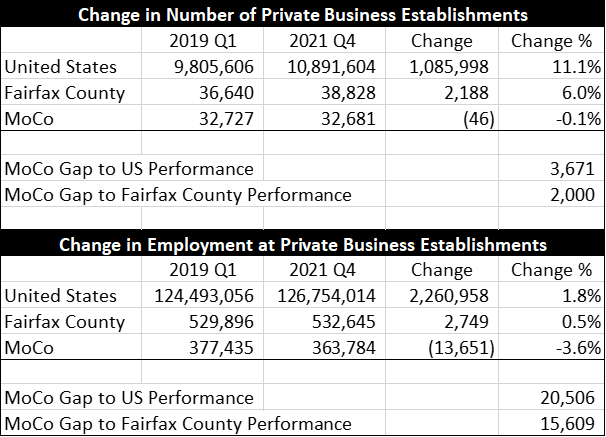
That’s right – if the County had performed simply as well as another jurisdiction in the DC area economy, there would be 2,000 more private sector business establishments and more than 15,000 more people employed in the private sector. Ugh.
Moving on from the general, long-time readers will not be surprised, but the industry that Mo Co is doing well at is one that seems to have limited room to grow in Mo Co – manufacturing. Mo Co added 45 establishments and about 750 employees (in contrast, Fairfax County and the nation both lost jobs here). Given how little has happened in some of the formerly industrial areas that are now zoned for mixed-use development, it does leave me wishing that Mo Co manufacturing had more room to grow.
With respect to information, which has been one of the County’s worst performing industries for nearly 20 years, the news was about as good as anyone could have reasonably expected. While employment is still more than 10% below where it was just at the start of 2019, it did finish 2021 with two consecutive quarters of growth. Let’s hope that is more than just a “dead cat bounce.”
A growing industry that is central to the County’s strategies and identity is life sciences, and total employment in research and development in the physical, engineering, and life sciences is up 13.5% over the 3-year period…which sounds great until you know that employment in the same industry in Fairfax County increased by 30.9% and is quickly catching up. At this point, Fairfax County is where Mo Co was (in terms of total employment) at the start of 2019. If Fairfax County keeps growing its employment in the industry by 30.9% every three years and Mo Co keeps growing at 13.5% every three years…Fairfax will pass Mo Co some time in 2025. As I’ve previously noted, Mo Co is not even the top Montgomery County in nation when it comes employment in this industry (that honor goes to Montgomery County, Pennsylvania).
Real estate and construction are two industries I keep a close eye on, and employment in both remained stable through the second part of the year. Nothing that would justify assuming lots of economic growth in the near future, but stable is better than where we were in both industries during 2019 and 2020.
With respect to the number of establishments in retail trade, Mo Co lost 202 such establishments during the 3-year period from 2019-2021 while Fairfax County only lost 23 (for the U.S. as a whole the number of establishments increased by 2%, reflecting the gap between the national and regional economies recently). Retail is one of those industries where I do pay attention to the establishment numbers.
Similarly, food services and drinking places also illustrates the changing fortunes of Mo Co relative to the region – from 2019 to 2021 Fairfax County gained 28 eating and drinking establishments while Montgomery County lost 90 of them. I find the retail and restaurant industries, and the differences between Mo Co and Fairfax performance in them, to be interesting given that Mo Co has been adding people and households at a faster rate (though as you probably know by now, at much lower incomes).
Overall, the 4th quarter was stronger than the 3rd quarter which is undoubtedly good…but more or less on par with other recent 4th quarters, so “move along, nothing to see here” from a seasonal standpoint.
MO CO BUSINESSES ARE MOSTLY SMALL BUSINESSES AND SELF-EMPLOYED
According to the Census’ County Business Patterns, there are 27,432 business establishments in Montgomery County, of which 19,112 (70%) have fewer than 20 employees. Among these employer establishments, the average number of employees is 16, indicating that MoCo businesses skew small.
When looking at the total universe of MoCo employer and non-employer establishments, 18.8% of total businesses are employer establishments. This is below the statewide number – 21.5% of Maryland businesses are employer establishments.
One key fact about self-employment is that gross receipts for non-employer establishments are below the salaries that employees working in those industries typically receive. For those who read these pages often, this is why I focus a lot of attention on the shrinking base of wage and salary employment in the County – sometimes shrinking wage and salary employment can be masked by increases to the self-employment component of “total employment,” but that can lead to a quantity versus quality problem. In many industries, the differences between wage and salary incomes and self-employment incomes can be huge.
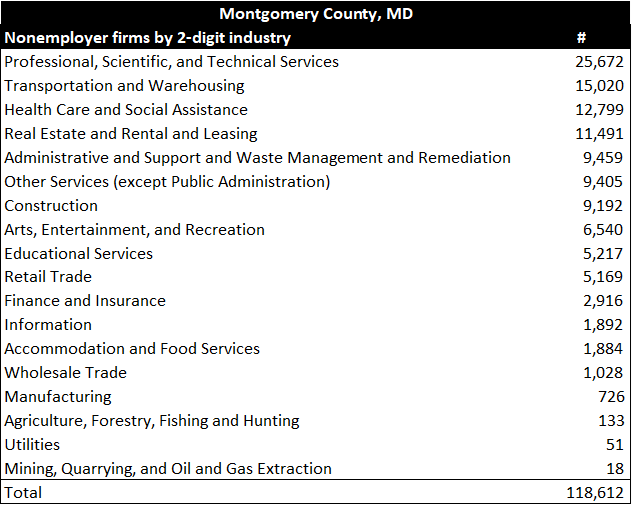
Unsurprisingly, self-employment is concentrated in professional, scientific, and technical (the most significant industry in the county), transportation and warehousing (at the more detailed level, we can see that this is largely in transit and ground passenger transportation and couriers and messengers and truck transportation), in health care and social assistance, and in real estate rental and leasing (think real estate agents and brokers).
NATIVITY AND CITIZENSHIP STATUS OF THE SELF-EMPLOYED
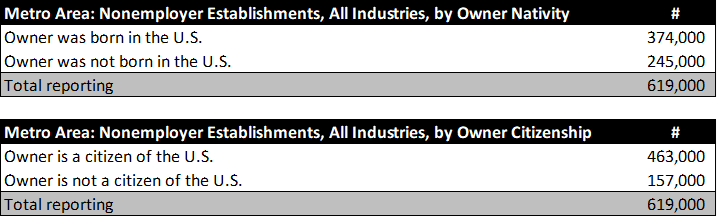
Independence Day is a good time to celebrate the contributions of our non-native and non-citizen populations. Across the Metro economy, 40% of the self-employed (i.e., non-employer establishments) were not born in the U.S. At the same time, 25% of the self-employed are non-citizens. These data underscore the significance of non-natives and non-citizens in the regional economy, and the entrepreneurial skills and spirit of immigrant populations across the D.C. region.
What the national economic debate needs is more businesses and business organizations advocating for increases in immigration, rather than a lot of pointless complaining about “kids these days” when the problem is really baby boomers aging, and all of the often disingenuous “where are all the workers?” questions when the answer is in part that they are trying to get here but we just won’t let them in.
I’ll just provide a few links and leave the rest to you. This 2020 National Bureau of Economic Research paper examines the role of immigrants in the economy, specifically in entrepreneurship. The Migration Policy Institute has an archive of that spotlights different immigrant groups in the U.S. The Cato Institute published a 2018 report on the fallacies of common anti-immigration arguments. The Center on Budget and Policy Priorities put together this analysis of the contributions of immigrants to the U.S. economy. This White House paper addresses the economic benefits of extending permanent legal status to unauthorized immigrants. This piece by the Joint Economic Committee provides an excellent summary of data and issues. The Penn Wharton Budget Model provides some good food for thought, including a specific finding that immigration leads to innovation.
REFLECTING ON INDEPENDENCE DAY
Frederick Douglass’ “What, to the slave, is the 4th of July?” is a text worth revisiting every year. If you haven’t read it, you should; if you have read it, you should consider reading it again anyway. In this passage, Douglass excoriates those who invited him to speak on the topic of liberty in celebration of the nation’s birthday.
What, to the American slave, is your Fourth of July? I answer: a day that reveals to him, more than all other days in the year, the gross injustice and cruelty to which he is the constant victim. To him, your celebration is a sham; your boasted liberty, an unholy license; your national greatness, swelling vanity; your sounds of rejoicing are empty and heartless; your denunciations of tyrants, brass fronted impudence; your shouts of liberty and equality, hollow mockery; your prayers and hymns, your sermons and thanksgivings, with all your religious parade, and solemnity, are, to him, mere bombast, fraud, deception, impiety, and hypocrisy—a thin veil to cover up crimes which would disgrace a nation of savages. There is not a nation on the earth guilty of practices, more shocking and bloody, than are the people of these United States, at this very hour.
Reading the entire address again this year, in the midst of the Congressional hearings on the January 6th insurrection, I was drawn to a passage that has probably never seemed as relevant to me as it now does.
…The freedom gained is yours; and you, therefore, may properly celebrate this anniversary. The 4th of July is the first great fact in your nation’s history —the very ring-bolt in the chain of your yet undeveloped destiny.
Pride and patriotism, not less than gratitude, prompt you to celebrate and to hold it in perpetual remembrance. I have said that the Declaration of Independence is the ring-bolt to the chain of your nation’s destiny; so, indeed, I regard it. The principles contained in that instrument are saving principles. Stand by those principles, be true to them on all occasions, in all places, against all foes, and at whatever cost.
From the round top of your ship of state, dark and threatening clouds may be seen. Heavy billows, like mountains in the distance, disclose to the leeward huge forms of flinty rocks! That bolt drawn, that chain broken, and all is lost. Cling to this day—cling to it, and to its principles, with the grasp of a storm-tossed mariner to a spar at midnight.
Watching the Congressional hearings on January 6th has led me to wonder: Is the chain now broken? Do we stand by the principles that impelled us to declare our independence? Are we true to those principles on all occasions, in all places, against all foes, and at whatever cost? Color me skeptical. Hang in there, folks!