
In this final “flotsam and jetsam” of 2021, we cover several topics relevant to the future of the MoCo economy: the changing nature of commutes, the future of work, the bioscience industry, and some 2021 research and articles on the economics of inclusionary zoning.
Changing nature of commutes
The Institute of Transportation Engineers has been contributing a lot to the discussions around COVID-19 and transportation and has been posting reports by reputable transportation research entities. One 2021 piece by TRIP, a transportation research non-profit in D.C., estimates that the impact of COVID-19 in Maryland has been a 16% reduction in average daily trips (April 2019 through March 2021). The TRIP report notes that transit volumes dropped by 80%, and remained 60% below pre-pandemic levels at the time of publication in May 2021. The report also cites Federal Highway Administration statistics noting that total Vehicle Miles Traveled are down on average 3% below pre-pandemic levels, though the state-to-state variations are large, with some rural states actually experiencing increases in VMT and many more urbanized states seeing much larger declines.
The report also cites a study of peak hour traffic in major metro areas. That report indicates that the PM peak in the D.C. Metro Area is nearly 20% below pre-pandemic levels (see bar 6th from right, below).
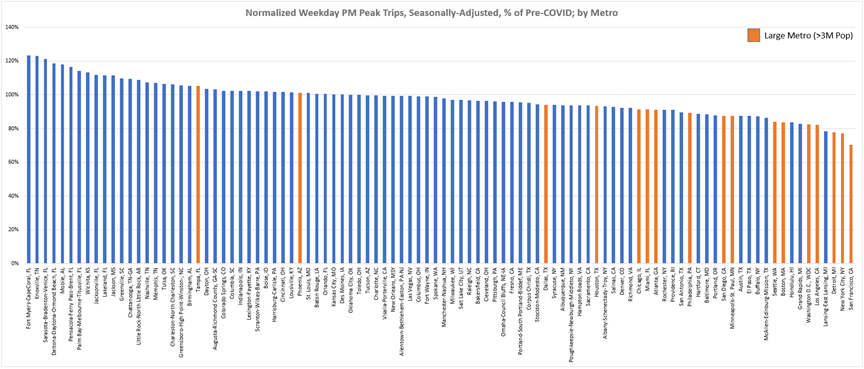
This (and other) data is telling us that the pandemic has really flattened the “peaks” that we experience as congestion. Put differently, the pandemic has helped us to achieve many of the goals of traffic demand management systems, which generally aim to promote changes to work and transportation patterns that reduce peak-hour congestion. As these numbers stabilize, it will be interesting to see how transportation planning, capacity allocation, master plans, impact taxes, and infrastructure investments change.
The future of peak hour traffic is an interesting topic to keep an eye on. This analysis of 400 cities suggests that peak traffic is declining in 387 of them and increasing in only 13. And one of my favorite tidbits from the piece is that in Minneapolis in 2020, traffic was at least 50% below 2019 levels for 219 of 366 days. And this piece from the WSJ addresses the new reality of really long peaks in many suburban locations, i.e. the “peak of peak” might not be as bad as it used to be, but the PM peak period lasts a lot longer.
Perhaps my favorite transportation piece this year was from the Upshot at the New York Times. The article points out how much of our transportation infrastructure and policy is geared towards addressing the “peak of peak”, and how much peak hour traffic flows are affected by small changes in traffic volume on the margins.
Which brings us to a separate and related topic – mode share. The Bond Buyer had an article that indicates that the market observers anticipate toll road revenues will be up 4% in 2022, with toll road volume up 2% and inflation toll adjustments making up the difference between YoY volume and revenue changes…Unsurprisingly, current data indicates that transit ridership is WAY down. Here is a look at some WMATA rail ridership numbers. Similarly, the WMATA bus ridership numbers are also way down. I recently picked a mid-week, mid-month day for YoY comparisons and it showed rail ridership down 74% versus 2019 and bus ridership down 35% versus 2019. That was just a quick look, a random date…but I think the larger point is clear: there are fewer people taking trains and buses than a couple of years ago, and the market’s expectation is that more people will be driving next year than have been driving this year.
As is always the case, it can be hard for policy and politics to react quickly to new information. Among the many current transportation trends to watch is this one: how quickly does transportation planning and policy adapt to a new normal in which more people work from home, more commuters drive alone, and fewer automobile commutes are occurring during the peaks. For example, will implementation of new transit capital projects continue on a pre-pandemic trajectory? Or will the policy and politics of transit change along with the working and commuting behaviors that have been observed to date?
Wrapping our minds around the future of work
I enjoyed this article about the market for remote work and factors that contribute to wage price-setting. The authors of this study posit that the location of the remote worker still accounts for about 1/3 of the price of labor.
As someone who has had a spouse working remotely for years, it is no surprise to me that remote work puts some of the costs of work onto the worker’s household. This study found that households with remote workers spend about 7% more on housing than households without remote workers. Which is probably about what we’ll spend to add an office to this house.
I suppose it is nice to have a major boost in productivity, even if the reason is a tragic global pandemic. This paper tackled some interesting aspects of the pandemic – the potential long-term impact on economic activity in business districts/city centers, and the positive impact of work from home on employee productivity. I think the authors’ headline conclusion is in the ballpark – at least 20% of workdays in the future will come from home. I’m a little less sanguine on the condition that this and so many other studies rely on, though – “when the pandemic ends” is a phrase that used to feel hopeful but now feels…a little too hopeful and bordering on delusional. Furthermore, it seems like a phrase that is being asked to do a lot of work right now – maybe more than it can. For what its worth, I think if what people mean is “I don’t know” then that is what they should say, rather than relying on an assumption that this will someday be “over.”
I’ve cited this one several times before, but it is worth including again. The authors, Dingel and Neiman, develop a set of assumptions about the percentage of jobs in each industry that can be done entirely from home. I have applied their methodology to MoCo’s industry mix and find that 40% of jobs done for MoCo employers can be done entirely from home.
I think the near-to-mid-term expectations for MoCo should probably fall somewhere in that range of 20% (low end) and 40% (high end). That is, I expect that leasing activity over the next 5 years or so will move us towards a stabilized impact in that range. Obviously, a really solid economic expansion could change that though it is hard to identify a potential driver for major increases in productivity from here, so “steady as she goes” might be a more realistic best-case scenario.
Top o’ the market to you
IPO activity in 2021 has been a bright spot. As someone who is a careful student of markets, I keep asking myself this question: would so many bioscience companies be going public right now if they weren’t confident that this represents the peak of the market for them? Put differently, why would you go public in the summer of 2021 if you thought you’d be able to get a better price in the spring of 2022?
The IPO activity in 2021 is fueled by both a lot of global liquidity, and relatively few investment opportunities in cyclical industries following a decade-long economic expansion. MoCo has a lot of bioscience assets, no question, and not as many assets in the electric vehicle space or other hot investment topics. And of course, a lot of MoCo’s bioscience assets are specific to vaccine R&D, which certainly gives us a leg up in key respects.
Looking at some of the recent data (e.g., this report by Ernst & Young; this handy tool by PwC; and these charts showing annual and monthly IPO activity) on IPO activity helps us understand when and where the money has gone. Mostly to technology and health care companies, and very heavily into the growth companies that make up the NASDAQ, and probably peaking in July and October. As a point of reference, current valuations (P/E ratios) for the NASDAQ are nearly 40% higher than current valuations for the S&P 500 – growth stocks, like those traded on the NASDAQ, are those that have the farthest to fall.
Federal Reserve tapering and continued economic volatility both present challenges for industries that generally trade at high multiples. The ratio of equities market cap to GDP is in the vicinity of 2.5x, at or near an all-time high. So, there certainly are reasons to be generally cautious about the near-term future of growth industries. And, given the amount of money that folks worldwide are trying to put to productive use, it should not be any surprise that investors are connecting “global pandemic” to “investment opportunity.”
That said, some analysts have recently expressed some “we’re past the peak” perspectives. For example, this RSM report notes that “This year [2021] will set the high-water mark for the most private capital invested in life sciences; however, the velocity of activity is decreasing, and the total number of deals will likely settle back into pre-pandemic levels.” I haven’t seen any particularly dark or troubling forecasts for the industry, but economic fundamentals certainly indicate that there will be less private money flowing into the industry in 2022 than in 2021 or 2020.
Given the above, I thought some info about the price activity of MoCo bioscience stocks might prove handy. These stock prices were pulled from Yahoo! Finance. Of course, market cap weighted price movement would be more interesting, but let’s just accept that share prices are good enough for today.
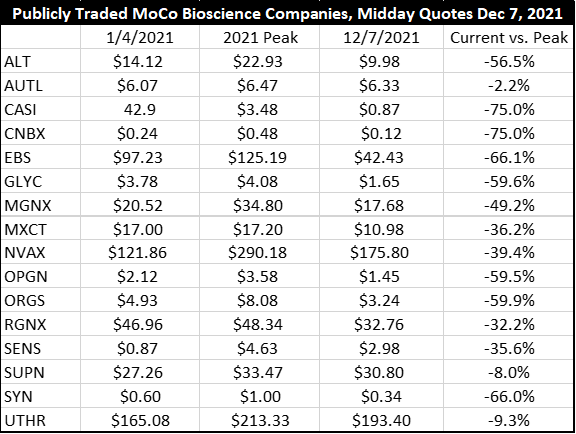
As you can see, most of these stocks are well off their YTD highs and many are well below where they were at the start of the year. So, while I think we should enjoy the fruits of all the investment that flowed into the bioscience industry post-March 2020, I don’t think we should be counting on this industry to be the answer to all that ails the MoCo economy. The set of conditions that led to massive capital inflows in 2020 & 2021 was fraught and difficult to repeat – a global pandemic that is in no way good news for the economy, a national economy coming to the end of a 10+ year expansion, and massive amounts of stimulus being pumped into the U.S. and global economies to ward off economic catastrophe.
Inclusionary zoning is a topic that economists love to study
There have been a few particularly interesting research papers on inclusionary zoning. And while I won’t get into too much detail, I do think the headlines are worth a quick review.
Joseph Gyourko is a top-notch urban economist, and was the author of two important articles published in the Journal of Urban Economics this year.
- “The local residential land use regulatory environment across U.S. housing markets: Evidence from a new Wharton index,” by Joseph Gyourko, Jonathan Hartley, and Jacob Krimmel, Journal of Urban Economics Volume 124, July 2021. Unsurprising is that generally places that are highly regulated in one respect are highly regulated in several respects, and that more highly regulated markets tend to have more separate public sector players involved in the approval process. Slightly less unsurprising is the finding that regulation basically always moves in one direction – towards more regulation.
- “The impact of local residential land use restrictions on land values across and within single family housing markets,” by Joe Gyourko and Jacob Krimmel, Journal of Urban Economics Volume 126, November 2021. This analysis looks at the difference between the marginal values of additional square footage of land to both homebuilders and homeowners. The gap between these values is the “zoning tax”. Analysis of zoning taxes in major metro areas reveal some really interesting distinctions. First, generally the “zoning tax” is a lot higher in NYC and in the major West Coast cities than it is in the D.C. area. However, the zoning tax in the D.C. area drops less as you move away from the urban core. So, land values in NYC may be a lot more affected by zoning restrictions than land prices in DC, but land values 15-30 miles from the core of NYC are actually below those 15-30 miles from the core of DC. Per the analysis, the zoning tax per ¼ acre within 15 miles of the DC urban core is $72,402, which declines only to $58,754 per ¼ acre in the circle from 15-30 miles to DC’s urban core.
I enjoyed reading this analysis from the Urban Institute about perspectives on inclusionary zoning. I like to challenge my own priors and getting the perspectives of people in adjacent fields or with related but different areas of expertise is always helpful towards that end.
All of this reminded me of the 2018 Housing needs study. This was the study that indicated that MoCo is really capturing very little of the region’s new housing, yet somehow 20% of the region’s lowest income households. This might indicate a need to re-evaluate some of the County’s social policies, or at least to have some concern about long-term fiscal sustainability in a county with very little new commercial growth.
Finally, earlier this year WaPo had an interesting article about housing affordability, zoning, and racial equity. If you missed it, it is worth the time to read it through.
Wrapping up
We’ll be back later this month with a year-end wrap on the MoCo macro – a review of the GDP data, personal income, at-place employment, and resident employment statistics that tell the economic story of 2020 and 2021 in MoCo. Until then…be well, stay safe, and shop MoCo!