
In this edition, we take a brief tour of the past 20 years of regional growth. Having used much of my monthly allotment of words in last week’s think piece, I’ll keep this one brief.
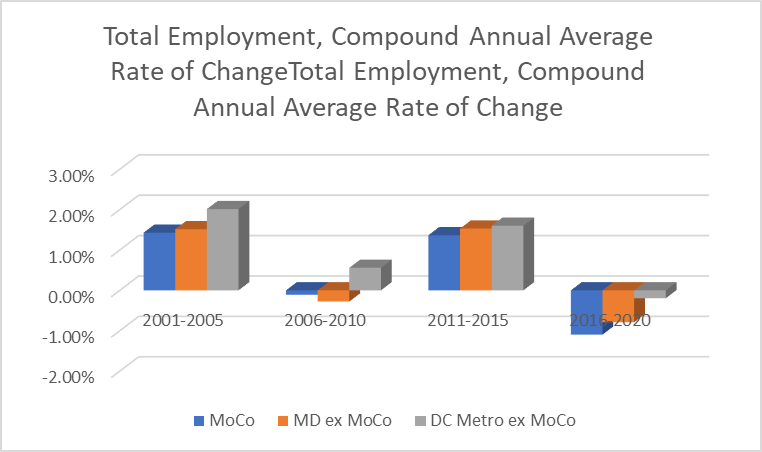
Total Employment
In terms of total employment, MoCo was 17.50% of regional total employment in 2001 and has since steadily declined; in 2020, MoCo total employment was just 16.03% of regional total employment. The table and graph below will provide some sense of the county’s divergence from the region and recent acceleration of economic decline.

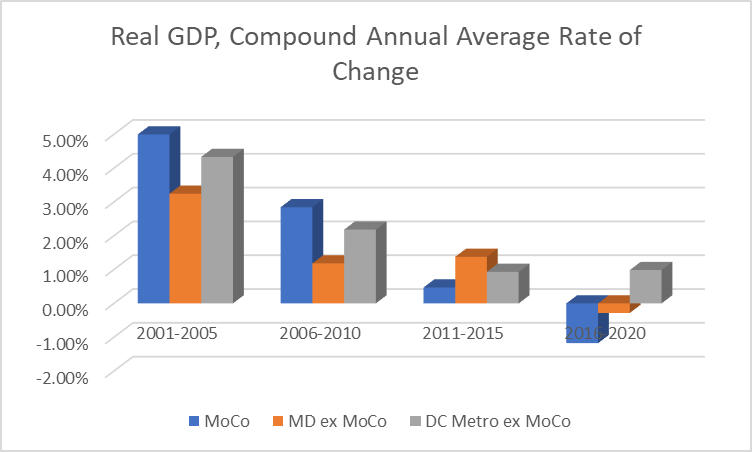
Real GDP
In terms of real (inflation adjusted) GDP, MoCo outperformed both the state and the region during the first decade of this century. MoCo was 17.17% of real regional GDP in 2001, peaked at 18.03% in 2017, and by 2020 declined to only 16.75% of regional GDP.

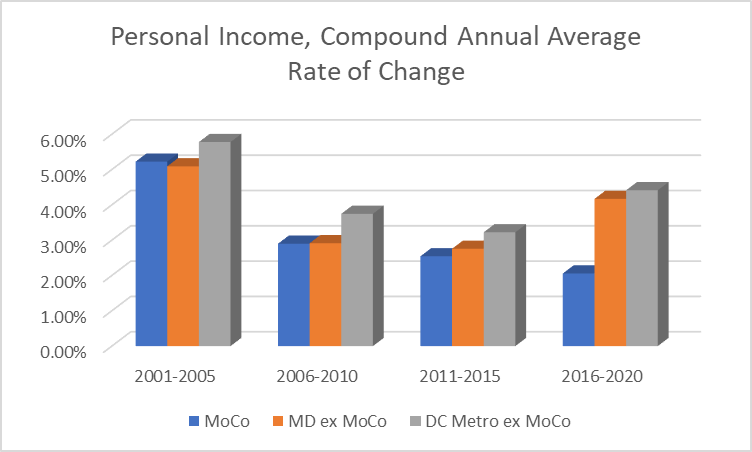
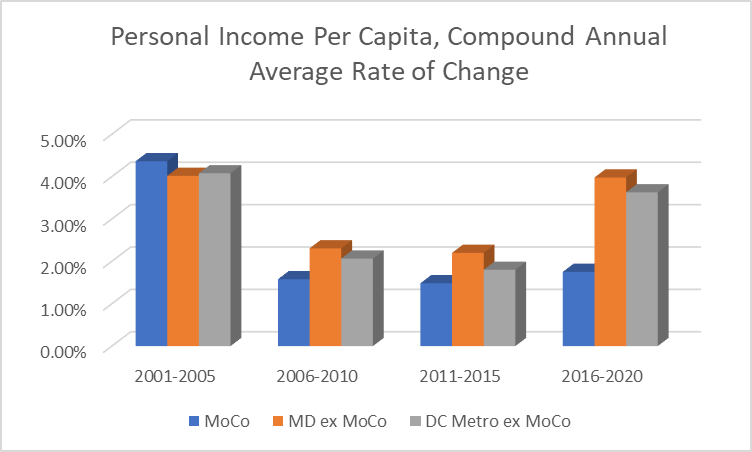
Personal Income
In terms of personal income, MoCo was slightly ahead of Maryland (excluding MoCo) from 2001 to 2005, while also nearly keeping pace with the rest of the DC region. It has been a different story since then, with MoCo personal income increasing by only an average of 2.06% per year from 2016 to 2020, compared to 4.17% for the rest of Maryland and 4.41% for the rest of the region.

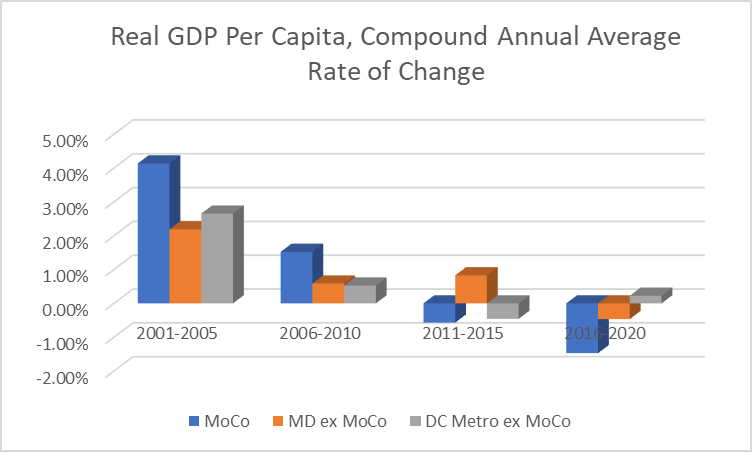
Real GDP Per Capita
Real GDP per capita is one of three quick measures of economic efficiency that we will examine this week. MoCo outpaced the region and the state from 2001 to 2005 and from 2006 to 2010. MoCo diverged sharply from the rest of the state and region over the past 10 years, most recently declining (yikes) at an average rate of 1.47% per year from 2016 to 2020, compared with the rest of the region’s modest growth of 0.23% per year in per capita GDP.

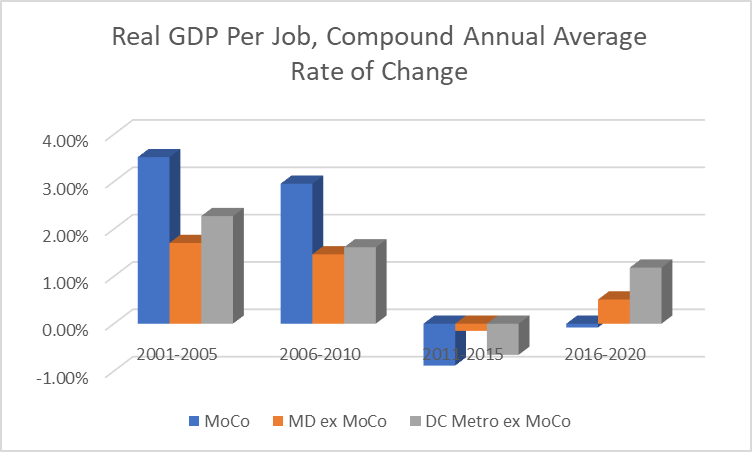
Real GDP Per Job
Real GDP per job is another quick measure of economic efficiency. Again, MoCo has really diverged from the state and region – as with other GDP measures, the decline has been quite steep since 2017. Real GDP per job actually declined (↓0.08%/yr) in MoCo for the 5-year period from 2016 to 2020, while the rest of the DC region went in the other direction (↑1.18%/yr).

Personal Income Per Capita
Another measure, another divergence…MoCo fared well relative to the state and region from 2001 to 2005, then fell behind but not out of sight. From 2016 to 2020 the divergence of MoCo from the rest of the state and region has been stark.

Wrapping up
As I have noted before, MoCo used to be the economic engine of Maryland, and now is an anchor weighing down the state and region. While we aren’t going to analyze the causes of that here, there are several suspects who may be jointly or severally responsible. Changes to tax policy and rates (both state and local), MoCo’s infatuation with land use exactions, MoCo’s penny-wise and pound-foolish approach to subsidies and incentives, and the loss of some specific large employers (e.g., Chevy Chase Bank and Discovery Communications) are contributing factors. MoCo’s aging population and workforce is likely affecting employment, labor force productivity, as well as some cyclical volatility in the county’s total employment figures. Declining capital investment, related to the factors identified above, as well as MoCo’s specific office-market related challenges and a general trend away from the land uses that are becoming a larger and larger share of commercial real estate investment nationally and globally (e.g., warehousing, data centers, industrial facilities, etc.) may be contributing as well. And of course, just generally there are agglomeration economies that are lost when specific industries begin to decline that can lead to a downward spiral in overall productivity and output.
I’ll be back with Flotsam and Jetsam at the end of the month – probably focused on the operating budget because…well, it is going to be a doozy! Until then…hang tight folks and stay safe.