In this month’s Flotsam and Jetsam, we explore a variety of topics, including: the state of the multi-tenant Class A office market, evidence of the growing gap between Boston and the DMV, and some more data about the really steep decline in MoCo’s real estate industry.
Headline numbers
Multi-tenant office vacancy, availability & net absorption
This month’s Headline Numbers focus on the multi-tenant Class A market. Bruce Lee, of Silver Spring’s Lee Development Group, always reminds folks that if you are looking at vacancies, you should be looking at the multi-tenant market (excluding single tenant buildings). Bruce is spot on from a macroeconomic metric perspective, and from the perspective of the ground truth in the area commercial real estate market. Single-tenant buildings are, by definition, occupied. And some jurisdictions – such as MoCo – have more of those single tenant buildings than their neighbors. So…with that said:
- MoCo’s office vacancy in Class A multi-tenant buildings is 20.5%, with available space at 24.7% of inventory.
- The MoCo numbers are similar to the region’s where (ex-MoCo) the totals are 19.9% vacant and 24.7% available.
- The thing that is different is the direction – MoCo and the region are converging but heading in different directions.
If you look at the last couple of rows you can get a glimpse of it – Q4 was modestly positive for the region but flat for MoCo; similarly, Q1 to date tells a familiar story, with a significant portion of the region’s net negative absorption coming from MoCo.

To put negative net absorption of 275,330 square feet into perspective, that’s roughly equivalent to losing two to three floors of occupied office space every week for the first seven weeks of the year. Not a great start to 2022…
Assorted recent data/current indicators
- According to the Energy Information Administration, Maryland’s commercial sector electricity use in November 2021 was 7.0% above November 2020. This represents a bigger increase than for the nation as a whole – U.S. commercial sector electricity use was up 5.6% during that same time.
- In Montgomery County there are 1,577 advertised openings for registered nurses, and 121 registered nurses with active resumés in the workforce development system. In contrast, there are 9 candidates running for 4 available at-large County Council seats – if the ratio of openings to candidates was the same as in nursing, then there would be roughly 52 candidates running for at-large Council seats.
- About 26 months into the pandemic, U.S. air travel numbers are generally bouncing around 20% to 25% below pre-pandemic levels. That they seem to be stabilizing in that range, albeit with a lot of volatility, is a good sign. While most of the business travel to the region follows the jobs (hello, Virginia and DC), and most of the tourism is focused on the downtown area and monuments. MoCo typically does benefit from “spillover room nights” when things get tight in town, but we’ll have to wait and see to what extent there actually is spillover when tourism events begin – the Cherry Blossom festival is our next key data point, and that will come about 3-4 weeks from now.
- CoStar’s Office Utilization Index indicates that office usage in the DC region is at 27.1% of pre-pandemic levels. This is down from a pandemic era high of 35.9% in early December, and up from a more recent low of 14.9% a month ago. This one is positive, but its hard to feel good about the trend given where we are.
- For Maryland, Scientific Research and Development Services jobs have had 4 consecutive good months. And for the Silver Spring-Frederick-Rockville Metropolitan Division, it has been 3 consecutive good months in Professional, Scientific, and Technical industries. These are both good signs – and based on the numbers this could get us part way back to our 2011 wage and salary employment level!
- I’ll often tell folks that I’m going to wait until the dust settles to draw too many conclusions about 2021 at-place employment. One reason is that the “real time” data seems to be telling a different story. Another is that darned divergence from the broader region, which can create some distortions in the way that BLS distributes jobs. A third reason might be to look at some of the resident employment and unemployment numbers in Frederick versus MoCo – the Dec 2021 versus Dec 2020 change in employed residents was 3.9% for MoCo compared to 4.6% in Frederick, while the labor force in MoCo grew by a measly 0.9% compared to Frederick’s 2.2%.
BOSTON VERSUS THE DMV
The Greater Boston area is experiencing a boom, and of course a lot of that is tied to the innovation there and specifically to the bioscience industries. As noted in a recent post, the greater DMV is not really in the same league as Boston when it comes to R&D jobs generally, or when it comes to lab space – in fact, Boston has about 6x our existing lab space, and 10x more square feet under construction. What we are really seeing right now is that Boston is growing its already substantial lead over everyone else.
A lot of that comes down to the fact that a lot more of what we think of as bioscience in the DMV is either government or health care, or government health care. Also, the environment for research and funding is a lot more favorable in Boston. In any event, I thought these directional indicators in the overall office market were interesting. Again, Boston is really soaking up a lot of commercial real estate demand and capital right now. And while the DMV numbers look better for the year ahead, we’re still growing at a much slower rate than Boston, and office properties in the DMV are seeing increases in net operating income (NOI) that are falling very far short of keeping up with inflation. That tightening of “real” margins will have an impact down the road.

stick a feather in your cap and call it macro-roni
Here I am, now living up in Maine, giving away one day per week to write an unpaid blog about Montgomery County’s teetering economy. So maybe I am the “yankee doodle” (fool) in this story. I spend the other four days a week managing chronic health conditions and a busy for-profit consulting practice, so I often wonder whether it is worth it. I can probably justify another few months of giving away 20% of my time for free, but eventually I’ll shift my creative energy to other topics, or perhaps I’ll shift my analytical energy to more consulting and less of this not-for-profit portion of my weekly grind.
I started this project because I had grand ideas about building a nowcasting and forecasting tool that would help me better project MoCo’s county-level GDP and personal income, and when I beta-tested the model it consistently overestimated current and future performance. Put differently, I tweaked a lot of factors and variables, but I could never really replicate Montgomery County’s underperformance. When the actual data came in, I would invariably find out that the model had overestimated MoCo’s strength.
That was inspiration enough for me – I decided to spend 20% of my workweek trying to better understand the MoCo economy using the luxury of time that being self-employed provides (a luxury I never had when working in MoCo for the Planning Department, County Council, and Economic Development Corporation)….And so far, every time I have gotten discouraged with the project, the universe sends me a sign that I should keep on going. So, I’ll spend the next few months writing this contemporaneous chronicle of MoCo’s decline, and we’ll see after that.
It may or may not help – after all, in 2022 the market for facts and in-depth analysis designed to help everyone arrive at consensus is just not as robust as the market for hot takes or the politics of division. But I do try to keep it factual and civil, and hope others will do the same.
With all of that said (and thanks for bearing with me), here is this month’s little nugget:

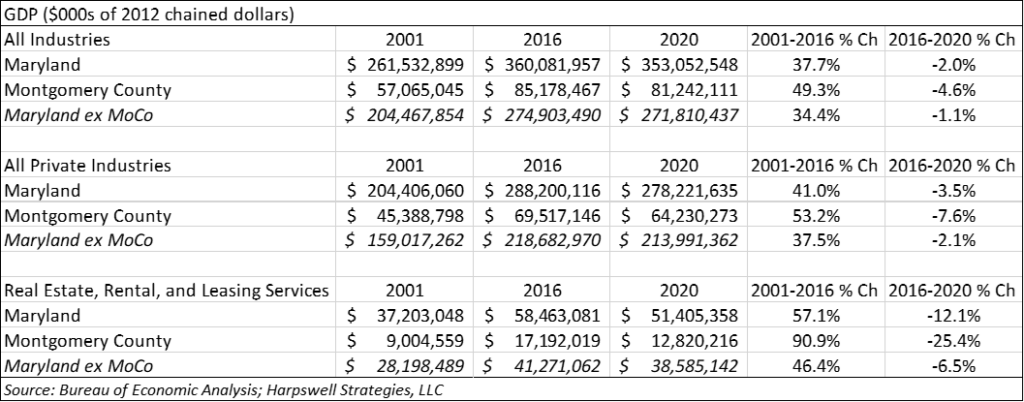
What these numbers show is that Montgomery County is the kid that is doing his or her own thing. Real Estate and Rental and Leasing is a significant industry. In terms of GDP, the industry peaked in 2016 at 20.2% of the County’s economy (down to 15.8% in 2020). In terms of employment, it peaked in 2018 with 47,523 jobs, but dropped nearly 4,000 jobs over the next two years and stood at 43,643 in 2020.
Check out the lower righthand corner of the table. MoCo had an astounding 25.4% decline in the inflation adjusted GDP of that industry in from 2016-2020, about 4x the decline for the rest of the remainder of the state. And it represented 111.1% of the decline in County real GDP decline from 2016 to 2020. Yikes.
I’ll be back in mid-March with more MoCo Economy Watch. Until then…be well, stay sane, and shop MoCo!


