This month we check out some recent stories and trends related to the federal real estate footprint and slowing job growth. These trends indicate some significant headwinds for the region. Does Mo Co have a plan to address them?
HEADLINE NUMBERS
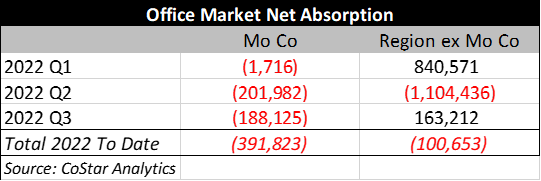
Mo Co has been a real drag on the region’s economy, but what’s new? Office net absorption for the entire D.C. area region has been ↓492,000 square feet this year; Mo Co has accounted for the lion’s share of that, with ↓392,000 (roughly 20-30 floors of newly empty office space compared to the end of last year).
No need to dwell on it – covered this ground before.
THE FUTURE OF THE FEDERAL GOVERNMENT OFFICE ECONOMY
The U.S. Government Accountability Office recently issued a report of interest to those who live, work, and invest in the D.C. region; readers can access the report here. The most interesting portion of the document is the appendix that contains the survey of 24 agencies. Some key takeaways are below:
- Only 4 of 24 agencies expect the amount of square feet leased to remain about the same over the next 3 years. In contrast, 16 agencies expect the amount of leased office space to slightly decrease, while 3 expect the amount of leased office space to greatly decrease (1 agency did not respond to this question).
- With respect to owned space, 18 agencies responded. Of those 18 agencies, 12 expect the number of owned square feet to remain about the same, while 5 expect the number of owned square feet to decrease slightly.
- Sixteen of 24 agencies have considered the feasibility of sharing space with other agencies.
- From March 2020 to March 2022, as a result of the pandemic agencies reduced the number of square feet leased by 524,740.
- Among the factors that agencies are considering when planning future space needs, 23 of 24 agencies identified teleworking policies as extremely important or very important. Lease length and flexibility is an increasingly important factor, with 18 of 24 agencies responding that the COVID-19 pandemic has made this either a “much more important” or “slightly more important” consideration.
The GAO recommendation is that GSA should share data and analysis related to federal space utilization with agencies, including those that do not rely on GSA for such services. “By not planning to more broadly share this information, GSA is missing an opportunity to provide a clear understanding of how the potential costs of collecting such data could be outweighed by the long-term benefits, including potential cost savings from reductions in future annual rent, maintenance, and other operational costs.”
Obviously, cost savings from reductions in future annual rent, maintenance, and other operational costs would have an impact on the D.C. area economy. If you are an elected leader, this is the sort of thing that you might want to start planning for now that you have the information. What’s that you say? These insights are not new? Well, I’ll be darned.
Here are some other recent pieces on the topic:
https://www.axios.com/local/washington-dc/2022/06/15/federal-government-dc-return-to-work
Obviously, some similar trends are affecting private sector real estate decisions.
https://www.bizjournals.com/washington/news/2022/09/09/return-to-work-washington-dc.html
https://www.washingtonpost.com/transportation/2021/10/25/downtown-dc-economy-covid/
UPDATED EMPLOYMENT PROJECTIONS FROM THE BUREAU OF LABOR STATISTICS
There is a high likelihood that national employment growth will slow over the next decade. It will be interesting to see how that slowdown is felt across metro areas and across jurisdictions within the D.C. area. This isn’t the first time I have addressed the issue, and I come back to it because it is really important: employment growth is a really important factor in the growth of the tax base and the affordability of debt financing for local capital projects and for the long-term sustainability of growth in the operating budgets of Montgomery County Government and its agencies. Without employment growth, the burdens of debt service payments and annual compensation increases will fall much more heavily on the residential tax base.
- On September 8th, the Bureau of Labor Statistics released its projections for 2021-2031. The BLS projects national employment growth over the decade of about 0.5% per year, which is half the rate of the previous decade. In several industries, employment has grown well above the projected rate during the first portion of the decade in question as a result of the rebound from pandemic-era job losses. This means that BLS expects the actual rates of increase over the remaining portion of the decade to fall below that mark.
- “Some employment lost during the pandemic and projected to be recovered over the projections decade has already been recuperated, as employment grew rapidly throughout the first half of 2022. As a result, some occupational groups have fast projected growth that reflects short-term recovery rather than long-term expected gains, such as the food preparation and serving related occupational group, which had already realized a notable share of its projected 2021−31 employment change by mid-2022.”
- In a recent Mo Co Economy Watch, I noted that the D.C. area economy has really underperformed other major metros when it comes to employment growth. I also noted that Oxford Economics projects job growth over the next 5 years that is well below recent job growth rates. As national employment growth slows, a smaller amount of national growth will be spread across the nation’s metro areas. While it is possible that there will be some “regression to the mean” for the greater D.C. area economy, obvious drivers of economic growth are absent, and the region faces some unique headwinds.
- Employment growth also affects growth and investment in commercial real estate. In April, we looked at the wide gulf between the performance of the D.C. area office market and those of other major metro areas when it comes to office inventory, growth, rents, sale prices, and net operating incomes. Those numbers were also…grim.
- All of this is occurring within a regional context: employment growth in Mo Co is truly underperforming the rest of the D.C. region and the rest of Maryland.
- Montgomery County’s FY23 budget is based on economic assumptions that include payroll employment increasing at a compound average annual growth rate of 0.91% from 2022 through 2025 (from 484,600 in 2022 to 497,900 in 2025). With respect to resident employment, the County’s budget assumes a compound annual rate of growth of 1.60% (from 529,100 in 2022 to 554,400 in 2025).
- The County’s projected rates (above) of employment growth for 2022-2025 are well above Oxford Economics’ projections for D.C. area employment growth over the next 5 years – overall, Oxford projects employment growth of 0.63% for the region over 5 years. This means that Montgomery County is projecting both that jobs in Montgomery County and jobs held by Montgomery County residents will grow at rates that are significantly above the rates projected for the region’s jurisdictions and labor force participants, which seems unlikely given the clear divergence of the County’s economic performance from the performance of the broader region and its aging population.
- The most recent Oxford Economics industry-level projections show employment in government increasing by an annual average of 0.57% in the region, which is just slightly more than the 0.53% nationally. And as noted above, this is an industry that seems to be pivoting quickly to having a smaller real estate footprint, especially when it comes to leased space.
SOMEONE IN CHARGE SHOULD HAVE SOME KIND OF PLAN!
As long time readers know, last year I recommended an aggressive expansion of existing real estate incentives as a way to (hopefully) cushion the short-term blow. The County Executive opposes this idea, though often the arguments sound a bit like someone saying that we shouldn’t have trauma centers and should instead focus on preventative health care – sure, but what do you do when a patient suffering from severe trauma shows up at the hospital door?
So, what is Mr. Elrich’s plan? We do have some evidence straight from the horse’s mouth, so to speak. The County Executive continues to tout his plan to build Bus Rapid Transit (using a tax on commercial properties along the corridors), so apparently the plan is more taxes to pay for more buses.
We also know how the County Executive will sell that – by claiming that because property tax rates in the County are lower than elsewhere in the region that Mo Co is a low tax jurisdiction. What he probably won’t talk about are the other taxes – the income tax, the energy tax, the transfer & recordation taxes, etc. As we’ve previously covered, the site selection community and businesses that are nearing the ends of their leases actually care about all of the taxes and not just that one. And, the actual tax burdens are actually a lot higher in Mo Co than elsewhere in the region – this is something we have also addressed multiple times, including last November.
Here are some key takeaways about taxes and spending from the last two linked articles:
- Own source revenues, the money raised locally (mostly from taxes) to be spent locally, are much higher in Maryland than in Virginia: own source revenue raised by local governments in Maryland are 12.8% higher than in Virginia, and when state and local governments are combined the number is 10.1%.
- State and local governments spend 14.1% more on current operations than their Virginia counterparts. For local governments alone, Maryland local governments spend 17.9% more on current operations largely because the per capita cost of wages and salaries for local government employees are 19.2% higher than they are across the river.
- We also noted that per the American Survey of Public Employment and Payroll, Fairfax County actually has 17.7% more full time employees than Mo Co does, but Fairfax’s payroll for full time employees is actually 4.7% below that of Mo Co.
- We also noted that compensation per full and part time state and local government employee in Mo Co is 14.7% higher than compensation per full and part time employee of state and local government in Fairfax County.
- Furthermore, we again noted that a key distinction between Maryland and Virginia is that net taxes (taxes on production net of subsidies on production) are much higher in Maryland than they are in Virginia for some of the industries we care most about (such as the professional and business services industries).
With respect to what companies care about when making location decisions, here is my summary of a report by the International Economic Development Council, the industry/trade group for economic development practitioners and organizations:
The IEDC report also identifies several examples of measures that can be used to understand the cost of doing business for those assessing the strengths and weaknesses of a community as an investment location. These include the following: state tax climate rankings; overall tax rates; corporate tax rates; personal property tax rates; corporate income tax rates; individual income tax rates; unemployment insurance; sales tax; gross receipts tax; worker compensation costs; and utility costs.
Notably, the list is not confined to costs for the real estate industry specifically. Rather, the identified set of costs is broad, and it includes not just impact tax rates and special taxing district rates, but also the full range of taxes and business costs as well as costs that relate to the individual employees and executives, such as the individual income tax.
The County Executive has repeatedly stated that the issue that needs to be solved is how to pay for infrastructure and that he is the man with the plan to provide the Bus Rapid Transit that will grow our economy. But it is interesting to note that other than his own assertions that the business community agrees with that assessment, there is little evidence that that is true. Responses by business leaders to the 2019 Maryland Business Climate Survey speak to this issue:
- Only 5% of Maryland businesses in the Washington suburbs identified “invest in infrastructure” as the single most important step.
- 13% of Maryland businesses in the Washington suburbs identified “reduce/reform regulations” as the single most important step that can be taken to improve the business climate.
- 33% of Maryland businesses in the Washington suburbs identified “reduce/reform taxes” as the single most important step; this was by far the most common response and was the choice of 6.6x more respondents than “invest in infrastructure”).
But as everyone “in the know” knows, the County Executive is singularly focused on the one solution he has been talking about for years – raising taxes on commercial properties to pay for buses.