Let’s catch up on some regional economic data after a 3-month hiatus. I have been on a “blogger’s sabbatical” because I am teaching a graduate public policy class and just haven’t had the time, but I’m ready to resume producing some economic content. This month, I’ll discuss a couple of datasets about businessowner income and profit, the most recent Maryland GDP and personal income data, and one very small part of the FY24 Montgomery County budget fiasco.
Nonfarm Business Proprietors’ Income
Here is what the numbers look like.

Owners of nonfarm businesses in Montgomery County have seen their incomes drop precipitously in recent years. Even after an uptick in 2021, nonfarm business proprietor income is about half of what it was as recently as 2016. These aren’t “real” or inflation adjusted numbers, so this means that business owner income is below where it was a decade ago in nominal dollars. Yikes.

In total, it looks like $5 B to $7 B (the big ‘B’ is for billions!) of nonfarm proprietor income vanished, mostly in three big drops: 14.8% from 2017 to 2018; 21.6% from 2018 to 2019; and 22.9% from 2019 to 2020. As a share of the total economy (personal income, like GDP, is a measure of the total size of the economy and the numbers end up being about the same regardless of whether you approach it from the income side or the output side), nonfarm proprietors’ income has fallen by about half – it peaked at 17.7% of personal income in 2016, and now is down to 8.5% of personal income.
How does all of this compare to the region? For most of the past decade, Montgomery County represented about 45% of the nonfarm business proprietors’ income in Maryland. In 2020 that dropped to 30.5%, before it ticked back up to 30.7% in 2021.
Here’s how Mo Co compares to some neighbors and peers in the region when it comes to the compound annual average rate of change.
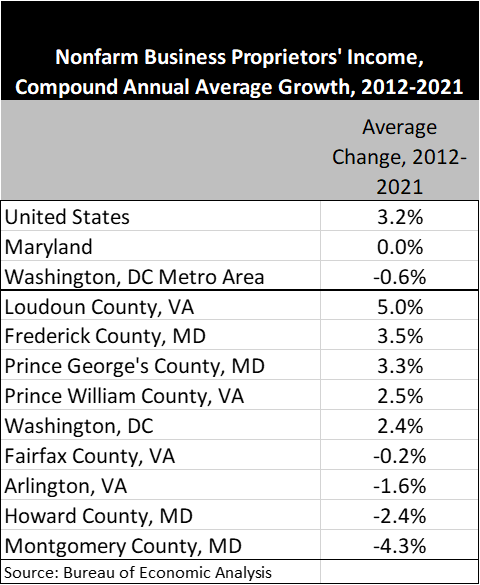
That tracks with what I would have expected to see…and yet…these numbers are still pretty shocking. Over the course of the past decade, Montgomery County businessowner income has declined by an average of 4.3%. For the United States overall, businessowner income has increased at an average annual rate of 3.2%.
Gross operating surplus
My slice of the policy world is a niche interest, and one problem for fetishists who are “really into local economics” is that some data is only available at the state level.
Gross operating surplus is the value left over after subtracting total intermediate inputs, compensation of employees, and taxes on production and imports less subsidies from total industry output. Given that compensation, taxes, and subsidies are all part of the definition, there is an obvious relationship between the gross operating surplus in an industry (or broadly in the private sector) and the economic and fiscal policies of state and local governments.
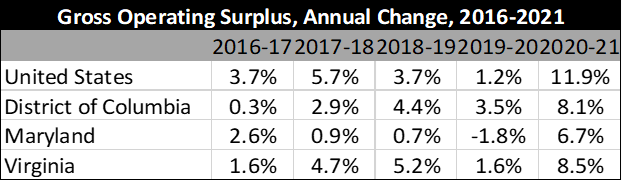
Overall, private industry gross operating surpluses in the region are growing somewhat slowly compared to the United States (+4.3% annually): D.C. gross operating surpluses are increasing at 4.1%; Virginia private sector gross operating surpluses increase at 3.5% annually; and Maryland lags a bit behind at 3.3% gross operating surplus growth annually. A little sluggish, but not remarkable.
The thing I want to keep an eye on is the trajectory, because things have been ugly since 2016.
2022 Maryland GDP and Personal Income
On March 31, the government released state-level GDP and personal income data for 2022. Maryland real GDP “increased” by 0.0% in 2022, well below the 2.1% increase for the United States. D.C. real GDP increased by 1.8% and Virginia by 1.5%, so all were below average.
In terms of industries, there are a few worth noting:
- If construction were Humpty Dumpty, then we’d say that he had a big fall, contributing -0.79% to GDP.
- Finance and insurance were up slightly nationwide but were “in the red” in Maryland.
- Information was up 0.43% nationally, and up 0.48% in D.C., but the data says it was down 0.35% in Maryland.
- Real estate, rental, and leasing services were up slightly for the year (good, and surprising) but as with the Minnesota Timberwolves this week and several times this year, it was a rough fourth quarter.
- State & local government was among the only bright spots – your tax dollars at work. Federal civilian government had a lackluster start followed by a strong finish to the year.
Maryland personal income was up 1.3% in 2022, below the 2.4% national average. Both the national and Maryland economies appear to have picked up the pace late in the year. There wasn’t much notable in the data about the sources of personal income or net earnings. Maryland growth was below the regional and national averages across types of personal income.
In terms of earnings by industry, again there wasn’t much particularly good or surprising in the numbers other than this: Professional, scientific, and technical contributed +0.57% to Maryland’s year-over-year earnings growth…which seems OK in a vacuum, even when you know that that is below the national and regional averages. However, it worries me that Washington, D.C.’s growth in this industry is…off the charts…having contributed +3.05% to the year-over-year change in earnings. I think this is what the kids in the real estate industry call “flight to quality,” as there has been a fair bit of movement in the professional services industries to trophy class buildings in the CBD.
FY24 Budget
There’s a lot to dislike in this budget, but I’m not going to dwell on it. That said, there is one issue that I do want to cover in my return to Mo Co Economy Watch because it is really, really important to many of your neighbors. It’s less a Mo Co budget issue than it is an issue that has resurfaced because of the budget.
This year, Group 2 residential property values increased by an average of 19.8% when compared to their previous triennial assessment. On top of that, the County Exec has proposed a substantial tax increase – if approved by the Council, rates would go up by 10.2%. It now may also be the case that some property owners will lose the $692 “income tax offset credit” (a local property tax credit authorized under state law).
Here’s what Council Staff Director Marlene Michaelson and Deputy Director Craig Howard had to say in their recent, excellent budget overview packet: As of March, there are approximately 80,000 property accounts in the County that do not have an application on file and therefore may no longer be eligible to receive the ITOC (recommended by the Executive to remain at $692 in FY24).
Here’s what this year’s tax bills could look like for some Montgomery County households: a $500,000 house prior to reassessment might now be worth 19.8% more (or $599,000). At the previous rate of $0.9785 per $100 of value, and with the $692 credit, a property tax bill on that property would be $4200. With the higher value and higher rate and no credit, a subset of Group 2 homeowners will find that their tax bill will have increased to $6574, an increase of 56%. And if there are 80,000 such households now countywide, then perhaps there are 20,000 or more in Group 2 alone.
If you are interested in learning more about the ancient history on the topic and the long debate over creating an application requirement, here’s a memo I wrote in 2016 when I worked at the Council.
To be fair, the idea behind the policy is that if the state makes households re-apply for the credit, then we can ensure that some households who shouldn’t be receiving the credit don’t. We know that there are some such households, and maybe many, and those scofflaws cost other taxpayers some dough every year in the form of rates that could be somewhat lower but aren’t. The question really is whether there is a good way to catch those folks without snaring a lot of others. If the only way to find out who’s a “Cheater Cheater Pumpkin Eater” is to cut off 80,000 households from the credit in a year in which there is also a 19.8% average valuation increase for the 1/3rd of residential properties that were reassessed AND a 10.2% increase in the property tax rate…get ready for a tax revolt.
Going back to my memo from 2016, when 96,000 folks had not yet filed their applications – note that 7 years later we are only down to 80,000! – this is the part that keeps worrying me:
The US Census does count housing units, occupied housing units, owner-occupied housing units, and renter-occupied housing units. Nationally, 65.1 % of occupied housing units are owner occupied (US Census, 2010). In Montgomery County, 67.6% of occupied housing units are owner occupied (US Census, 2010). Given the County’s historically suburban nature and relative wealth, it is easy to imagine that actual homeownership numbers would be somewhat higher than other locations. If one were to assume that all 96,000 applications that have not been submitted represent homes that are not actually owner-occupied, then that would mean that the actual percentage of Montgomery County occupied housing units that are owner occupied is 40.7%, well below the 65.1 % national average. This significant deviation is difficult to explain given the sample sizes involved and suggests that the vast majority of the 96,000 homes are indeed owner-occupied. In all likelihood, the actual number of owner-occupied principal residences is similar to the number of households who receive the credit in any given year.
Most of these folks are probably just homeowners who don’t follow what’s going on, are too busy, lack access to good local media, don’t want to share their social security numbers, or haven’t had any reason to verify their information with the state because the only reason historically to do so was to ensure that you would remain eligible for a different tax credit, the so-called “circuit-breaker” that only kicks in when property values are going up by more than 10% (which they generally haven’t been doing for many years until recently).
One of the concerns we discussed back in 2016 was the impact on peak staffing demand: Of course, many of those that lose the credit would contact the County (through 311), legislators, the state delegation, and the press. Ultimately, individual appeals could end up in tax court. Among the potential consequences would be a need for peak demand staffing at 311, additional staff in Finance, Division of Treasury, a need for tens of thousands of revised property tax bills with increased processing and printing/mailing costs and issuance of refund checks plus interest, and a great deal of uncertainty in the property tax revenue estimates. Given that the recommended budget includes a year-over-year increase in tax supported spending of close to half a billion dollars, you’d be forgiven for incorrectly assuming that any of that was going to fund new positions in 311 or the Treasury Division. No worries – there’s always an opportunity for a summer supplemental appropriation if the need arises! This will be one to watch.