This week, we peek behind the curtain to see what we can learn from modeling Mo Co’s 2020 GDP. We find that 2020 GDP is down at least 0.8% to $94.8 billion, meaning that Mo Co will have fared somewhat better than the nation as a whole or Maryland. We also take a look at non-residential fixed investments, and don’t see many reasons there to increase the GDP estimate or longer-term outlook.
THE MO CO MACRO
County-level GDP data for 2020 will not be released until early December of 2021. As such, the most current County-level GDP data is annual data (average quarterly) for 2019.
That said, we can learn some things from just looking at U.S. and Maryland GDP data for 2020. I’ve been building and beta-testing a Mo Co GDP “Nowcast” tool this year, which is loosely based on the Atlanta Federal Reserve Bank’s nowcast for U.S. GDP. One module I am building uses national and state data releases to get the “nowcast” partway there.
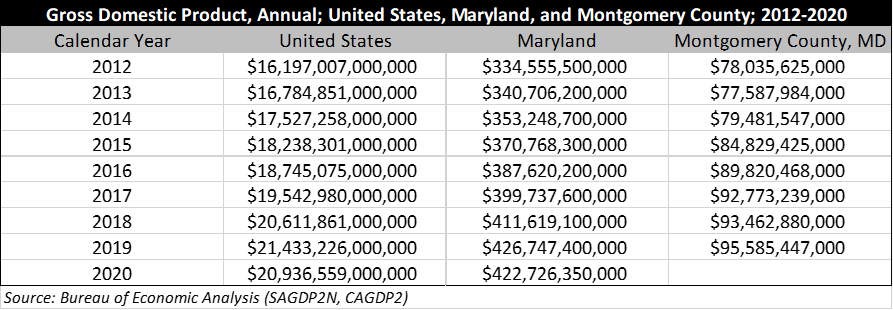
U.S. nominal/current dollar GDP (annual) was down 2.3% in 2020. Meanwhile, Maryland GDP was down only 0.9%. That these numbers are different reflects, among other things, differences in the industry mixes at the national and state level. The differences in these numbers also reflect local effects and productivity factors, but we’ll mostly leave that to one side for now.
With respect to industry mix, government and government enterprises generally account for about 12.5% of U.S. GDP. In contrast, government and government enterprises account for about 20.5% of Maryland GDP. As such, the extraordinary levels of government service needed to address the pandemic – and stimulate or stabilize the economy – had a larger impact in Maryland (↑2.3% in 2020) than nationally (↑0.2% in 2020). We’d expect something similar in Montgomery County, where the public sector is about 19.2% of the overall economy (somewhat lower than Maryland overall, in part reflecting the significant military components of the Maryland economy at sites outside of the County, such as Fort Meade and Fort Belvoir).
Leaving aside government and government enterprises for a moment, private sector GDP nationally dropped in 2020 (↓2.7%) more than it did in Maryland (↓1.8%), which again will reflect some combination of industry mix factors as well as local performance/productivity factors.
Just looking at the 2020 U.S. and Maryland GDP numbers, it might be reasonable to expect Mo Co 2020 GDP to come in at around $94.1 billion (down from $95.6 billion in 2019). Applying 2020 industry-level national and state growth numbers to Montgomery County’s 2019 GDP supports that notion, leading to a preliminary estimate of $94.8 billion. This is actually somewhat below 2019, but relative to the U.S. and Maryland numbers it looks pretty good (↓0.8% versus ↓2.3% for the U.S. and ↓0.9% in Maryland). Put differently, Mo Co’s specific mix of industries could result in 2020 GDP that is around $700 million larger, or 0.8% above, where it would be ‘but for’ that mix.
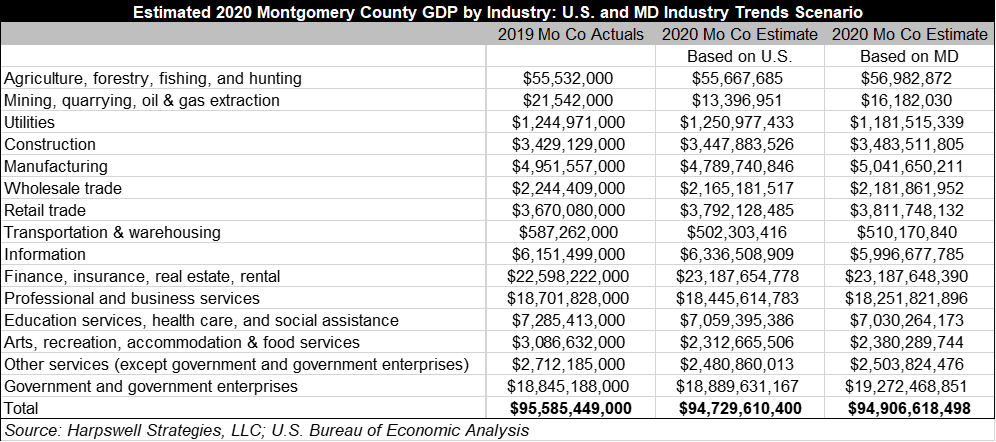
Approximately 1/3 of that difference relates back to the government and government enterprises industry being larger in Mo Co than it is in the broader U.S. economy. That part I feel pretty confident about. I’m less confident in the largest source of 2020 upside, the so-called FIRE (finance, insurance, and real estate) industries, and as a result I wouldn’t be shocked if 2020 County GDP comes in somewhat lower than $94.8 billion (closer to $94.5 billion).
Nationally, GDP in finance and insurance increased by 3.7% in 2020, though in Maryland that figure was even higher with a 5.5% increase over 2019. In recent years the growth rate in Mo Co’s finance and insurance industries has underperformed the growth rate for both the nation and the state (on average about 0.4% below the nation’s growth rate and 1.4% below Maryland’s growth rate). So, industry mix is part of the equation, but industry performance can’t be ignored entirely. Recently, Mo Co has underperformed relative to the nation and to Maryland when it comes to real estate, rental, and leasing services. Since 2012, on average the growth rate in Mo Co’s real estate industry is about 0.4% below the growth rate for the industry in Maryland and about 1.3% below the growth rate for the industry nationally. Whether it is a trend or a blip, the data for 2017-2019 show a real estate industry in the County that is performing well below the level of the industry in both the U.S. and Maryland.
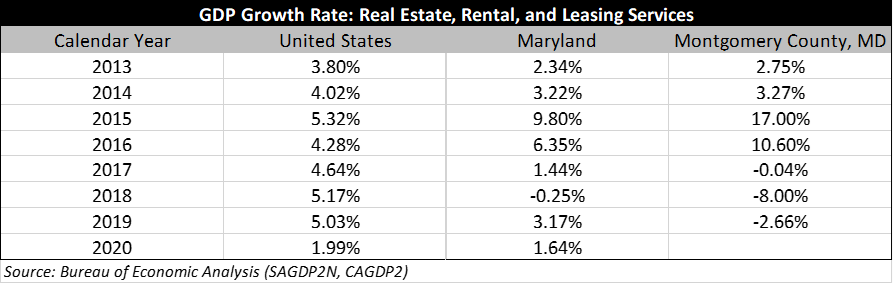
In fact, contraction in the real estate, rental and leasing services industry has been a big source of Montgomery County’s recent economic struggles. To wit:
- In 2017 County real (inflation adjusted) GDP increased by 2.00%, but that number would have been 0.44% higher but for the real estate industry’s contraction;
- In 2018 County real GDP went down by 1.3% though it would have increased but for real estate, which contributed -1.93% to GDP;
- In 2019 County real GDP increased by 0.4%, though it would have increased substantially more but for real estate’s contribution of -0.95% to County real GDP.
At this stage, my “prior” is that this trend continued in 2020 and that Mo Co’s 2020 real estate growth will fall below both the national and Maryland growth rates in the industry. I’ll come back to this in a moment.
When it comes to sources for upside, I’ll be keeping an eye on 2020 manufacturing GDP. In past newsletters I’ve noted some steady-to-strong performance in the local manufacturing industry. While manufacturing is only around 5.2% of Mo Co GDP and about 6.5% of Mo Co private industry GDP, Mo Co’s nondurable goods manufacturing industry has been growing at a rate that is well above the national and state growth rates (about 12% above the national growth rate and 9.6% above the Maryland growth rate).
Long term, a challenge is that there isn’t a lot of land for manufacturing in Montgomery County and there are a number of locations across the region that can out-compete Montgomery County on industrial land prices. So, I feel like there is more upside here to benefit from in the near-term, though from a long-term standpoint we may soon reach the hard part of the manufacturing industry growth curve at which point we’ll need to look elsewhere for growth.
NON-RESIDENTIAL FIXED INVESTMENT
Nationally, fixed investment in non-residential structures accounts for about 2.5% of U.S. GDP. And whether you are measuring from the recent peak (3rd quarter of 2019) or right before the pandemic (1st quarter of 2020), non-residential fixed investment in structures is down about 20% right now. There has been some very modest recovery over the past two quarters, but when it comes to fixed investment in non-residential structures the U.S. economy is only about 1/10th of the way back to where it was before all of this began in March of 2020.
Nationally, the strength of private fixed investment in non-residential structures has been in warehousing, data centers, and manufacturing. This is evident both in looking at the starts data as well as the investment data used in the national economic accounts for things like calculating GDP.
Locally, the opportunities to invest in warehousing, data centers, and manufacturing in Montgomery County are limited. For a sobering (but dated) look at how much such land has been rezoned, check out this 2013 report which documented a fairly substantial loss (~20%) of industrially zoned acreage between 1993 and 2012. And while some companies are making big investments in warehouses and data centers, those same companies are investing very little in Mo Co, as we have previously explored. For example, Amazon has invested more than $10 billion in warehouses over the past 3 years, per Dodge Analytics. But Mo Co is home to only 0.9% of Amazon’s current real estate footprint in the DC-area market.
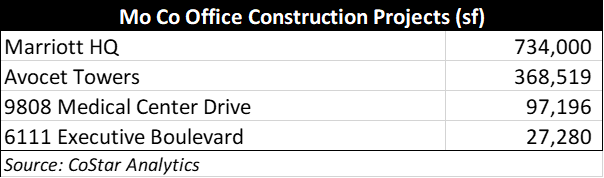
One way to get a sense of where new investments in non-residential structures are occurring is to examine the data collected by private sector, third-party vendors such as CoStar. CoStar’s dataset includes 37 current office construction projects underway across the D.C. region totaling 9.4 million square feet. Of that total, 4 are Montgomery County projects and the total for the 4 is about 1.2 million square feet.
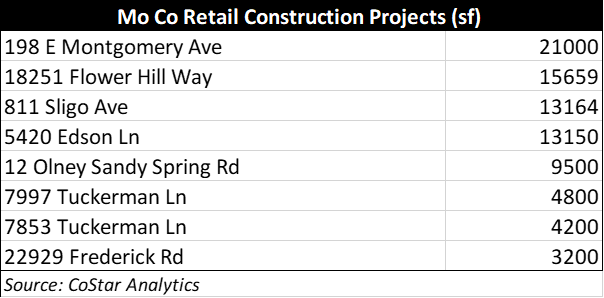
Montgomery County is home to 8 of 79 retail projects under construction across the region (3 of the 8 are child day care construction projects, which are classified as retail). The total amount of retail space under construction in the County is approximately 85,000 square feet out of a total of 1.9 million square feet across the region.
With respect to hospitality projects, a total of 465 rooms (2 projects) are under construction in Montgomery County out of 3,931 rooms (20 projects) across the region. All of the Montgomery County hospitality construction is located in Bethesda.

Two significant flex projects (Matan Companies) in Montgomery County on North Frederick Avenue amount to nearly half of the flex square footage under construction in the region (620,000 square feet out of 1.4 million under construction).

Turning to industrial projects, CoStar identifies 32 such projects totaling 5.8 million square feet in the region. On the other hand, CoStar identifies zero new construction projects in Montgomery County for industrial land uses – no warehouses, no distribution centers, no data centers, and no manufacturing facilities.

This is not unexpected, but it is important enough to highlight – there are 5.8 million square feet under construction elsewhere in the region and zero in Montgomery County.
This trend is important because industrial land has been among the best performing land uses in recent years. For example, current industrial market conditions in the region include absorption, deliveries, and rent growth that are 30%+ above recent averages.
Furthermore, manufacturing has been among the best performing sectors in the County’s economy – for example, total compensation in the nondurable goods manufacturing industry has been increasing at a rate that is about 3x greater than the rate for all industries in the County (↑63.2% versus from 2012-2019, versus ↑21.1% for all private sector nonfarm compensation during the same period).
Office, retail, and hospitality development are likely to face substantial headwinds in terms of demand. Of course, new construction everywhere and of every type is confronting rapid increases in the costs of materials (30%+ above general inflation) and a shortage of labor. However, money is being spent on constructing new non-residential structures. Unfortunately, given the kind of structures that are being developed it is unlikely that Mo Co will benefit much from the spending. Unless the County can capture more data center, warehouse, and manufacturing investments, the upside in private fixed investments will mostly be in residential structures. And new residential development is much more likely to be “net negative” from a fiscal standpoint due to the demands on K-12 education, a key distinguishing factor between non-residential and residential growth.
SUMMING UP
In summary, I see 2020 GDP as a modestly positive story – probably down 0.8% or more, but there are reasons to think that it ended 2020 down less than the U.S. or Maryland. Some positive developments in the County’s manufacturing industry continue to provide reasons to cheer, though the scarcity of industrial land – reflected in the absence of new industrial construction projects – is likely to limit the upside over the longer term.
For those who are interested, I had a really fun discussion with a local podcaster and all around super-smart guy Sunil Dasgupta last week on his podcast – have a listen and subscribe! Also, Harpswell Strategies has been “in the news” a fair bit this summer, including the following:
- This Washington Post article summarizes a report I recently did for Empower Montgomery on the need for more robust economic development incentives.
- This opinion piece I wrote was published in Bethesda Beat highlights the urgency of addressing the County’s economic decline.
Be well, stay safe, and shop Mo Co!