
In this edition of Mo Co Economy Watch, we provide some year-end updates on real estate markets and labor/employment data. These are some of the best “high frequency” indicators that we have regarding the (more or less) current state of the local economy.
The data confirm that a significant chunk of the region’s negative net absorption, in both the office and retail markets, is in Mo Co; that multi-family rents in Mo Co are below the region on a per square foot basis, that the number of units is growing considerably more slowly, and that rents are growing somewhat faster than elsewhere, most likely as a result of the slow growth in supply; second quarter employment data indicates that out of the 355 most populous counties in the U.S., Mo Co and 16 others did not add employment while the other 338 saw increases; recent metro area statistics indicate that the D.C. area continues to grow slowly relative to peers, and that the Maryland side in particular is having trouble finding a labor force.
Recently, I have been keeping close tabs on local and national economic data. Like many folks, I believe that a recession in 2023 is more likely than not. Furthermore, it is always hard to say when NBER will say that the recession began, and recessions are declared on the basis of national statistics and not local ones. While month to month changes in local economic data can be more noise than signal, I try to follow along.
As a reminder, the National Bureau of Economic Research’s Business Cycle Dating Committee determined in December of 2008 that the Great Recession began in December 2007. In December 2007, Mo Co’s unemployment rate was at its lowest point – a remarkable 2.4%. So, I don’t take too much comfort from the fact that things don’t look dire yet.
Of course, an economic crisis and a fiscal crisis are two different things. For those in public service, including elected officials, the fiscal crisis is often what brings the economic crisis to life. As I noted recently, whatever downturn we experience in 2023 is unlikely to have a significant effect on local revenue for multiple years. Let’s hope that the absence of fiscal crisis is not interpreted as a license to over-regulate the economy, because the economy is going to need a lot of help given some of the headwinds.
Later this month I will review some new 2021 data on GDP and Personal Income to see looking in the rearview mirror provides any additional insights. For now, let’s dig in on real estate and employment…
Mo Co’s real estate economy
Let’s examine some indicators of what is happening in some key real estate segments, both in Mo Co and the region…
Office
According to CoStar, the number of office buildings in Mo Co peaked at 1,565 in early 2010 and is now down to 1,521, a net decline of 44 office buildings. Across the region, the number of office buildings peaked in 2019 at 11,901 and now stands at 11,843, a net decline of 58 office buildings. In terms of new office buildings, Mo Co has added 14 over the past 5 years…while the region as a whole has added 129 new office buildings.
Five years ago, the office vacancy rate for the region (12.1%) and for the County (11.9%) were very similar. Since that time, Mo Co has shot ahead – the office vacancy rate is now 17.2%, compared to just 14.4% for the region. This reflects the fact that the County really has been dragging down the region when it comes to occupancy and absorption: while Mo Co is something like 12% to 14% of the region’s office market, it represents about one third of the region’s negative net absorption, and decline in occupied office space, over the past 5 years. So, yeah, Mo Co is an anvil.
Retail
Over the past 5 years, the region has added (net) nearly 4.1M square feet of retail space (CoStar Analytics). Of that amount, the County represents merely 0.4%, or 16,170 square feet.
The vacancy rate in Mo Co is a little higher than it is across the region (5.0% versus 4.6%); however, the vacancy rate has increased much more in Mo Co over the past 5 years than it has elsewhere. In terms of the numbers of SF of vacant retail space, Mo Co accounts for 40% of the region’s increase in retail vacancies (704K out of 1.775M square feet of additional vacant space in the region) over the past 5 years.
I’ve said it before and I’ll say it again: so many of Mo Co’s new households are of the low and very low-income variety, and as a result there isn’t much residential growth here that will drive investment in new Mo Co retail venues. This can lead to a downward retail spiral because those who have money can (and do) choose to shop in newer stores that reflect their preferences in terms of shopping environment and in terms of products/retailers.
Multi-family
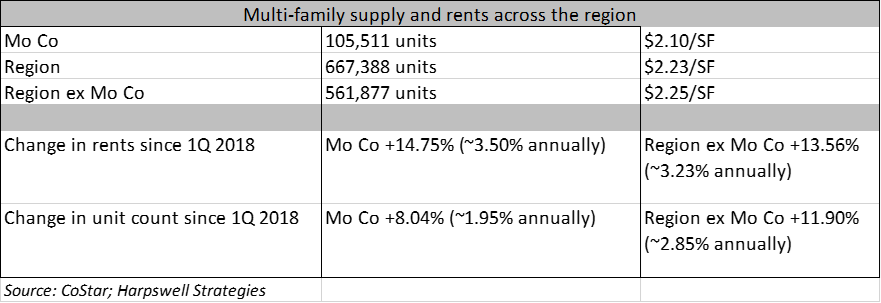
Per CoStar, rents in Montgomery County are, on average, lower than elsewhere in the region on a per square foot basis ($2.10 versus $2.25 for the rest of the region excluding Mo Co). Rents in Montgomery County have, on average, increased at a faster rate than elsewhere in the region (increasing at a compound annual rate of 3.5% in Mo Co, and at a compound annual rate of 3.2% for the region excluding Mo Co).
Montgomery County’s share of the region’s multi-family units has declined somewhat over the past 5 years. This is reflected in the compound average annual rate of growth in the number of multifamily units – 1.95% in Mo Co, and 2.85% for the region excluding Mo Co.
Mo Co has a housing supply problem more than a housing price problem; the new rent control legislation indicates that rather than address the supply problem, the County is going to try to regulate prices as a way out of this. Historically this approach hasn’t worked…but when you have a hammer, keep pounding things with it!
Hospitality
Per CoStar, there are 17 hotels (~3,400 rooms) under construction in the region, none of which are located in Montgomery County. In terms of 12-month demand for rooms, Mo Co is down about 47% from January of 2018, while demand in the rest of the region is down a little less than 11%. Average daily rates are similar in Mo Co and the rest of the region and have changed little over the past 5 years.
Business travel faces headwinds, jobs in the region are moving across the river, and Mo Co’s hotels often served overflow from demand in closer-in locations. If the headwinds end up reducing both Mo Co-based business demand and the region’s overflow, then Mo Co demand will be slow to recover.
New Labor Market Data from the Quarterly Census of Employment and Wages
On November 22, the Bureau of Labor Statistics released new 2nd quarter data for counties. According to the press release: From June 2021 to June 2022, employment increased in 338 of the 355 largest U.S. counties…In June 2022, national employment increased to 149.9 million, a 4.0-percent increase over the year, as measured by the Quarterly Census of Employment and Wages (QCEW) program.
According to the data, Montgomery County found itself on the outside looking in, part of the much smaller group of 17 counties (roughly, the bottom 5% of large counties nationally) that experienced a decline in employment for the 12-month period ending in June 2022 (ranked 340th of 355). Here is the data for some key jurisdictions in the region:
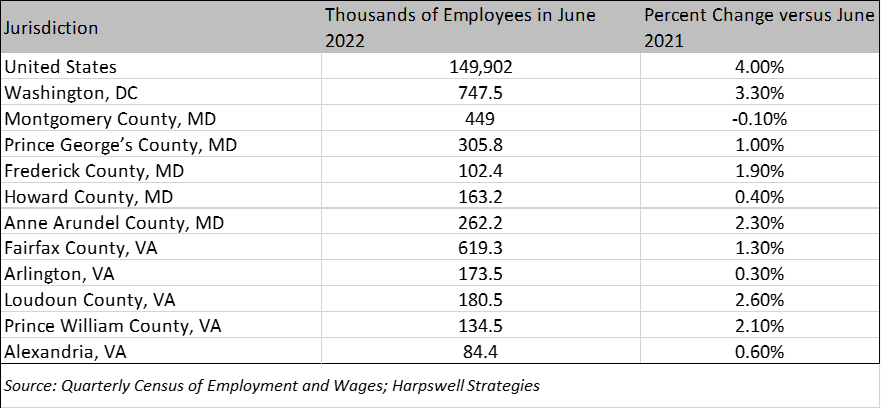
As might be expected, this relatively muted demand also led to less upward pressure on wages than is visible elsewhere; Montgomery County workers experienced a 3.1% increase in average weekly wage (2nd quarter 2022 versus 2nd quarter 2021) compared to an average of 4.3% nationally. Again, Mo Co trailed most other jurisdictions in the region – for example, Frederick County wages increased by 7.3%, Prince George’s County wages increased by 4.9%, Loudoun County wages increased by 8.5%, Fairfax County wages increased by 4.2%, etc.
I am writing a year-end post on why growth matters, so I won’t get into the weeds…but there are really two main forces driving growth in an economy: the size of the labor force and the productivity of the labor force. The data indicate that Mo Co did not score particularly well on either count during the second quarter of 2022. Just a quick benchmarking note, the May 2022 baseline economic projections by the Congressional Budget Office assume a 1.9% real GDP growth for the projection horizon period, comprised of labor force growth of 0.4% and labor force productivity growth rate of 1.5% (which is equal to the 1.5% average annual increase in the number of people participating in the labor force since 2010).
New Employment and Unemployment Data for Metropolitan Areas
On December 1, the Bureau of Labor Statistics released monthly employment and unemployment data for October 2022. The unemployment rate remains low – 3.3% for the region as a whole, 3.6% for the Silver Spring-Frederick-Rockville Metropolitan Division, and 3.2% for the Washington-Arlington-Alexandria Metropolitan Division – though up 0.2% across the board since the September numbers were released a month ago.
I usually look forward to this release mostly for the labor force participation numbers.
- From October 2021 to October 2022, the total size of the region’s labor force increased by 8,453 (+0.56%). The breakdown by metropolitan division is illustrative: Silver Spring-Frederick-Rockville’s labor force increased by 34 (+0.005%), while the labor force for the Washington-Arlington-Alexandria portion of the region increased by 8,419 (+0.31%).
- From September 2022 to October 2022, the total size of the region’s labor force increased by 18,696: Silver Spring-Frederick-Rockville’s labor force increased by 2,638 (+0.39%) and Washington-Arlington-Alexandria’s labor force increased by 16,058 (+0.60%).
The Maryland portion of the region continues to lag the national economy when it comes to the labor force. An aging population is certainly one of the headwinds, but others (including an uncertain policy landscape that discourages investment) also contribute.
As far as DC-area employment is concerned, the October 2021 to October 2022 change of 64,300 jobs represented a 2% increase (this is the combined figure for both metropolitan divisions within the metro area). How does this compare to other metros?
- Crossword puzzle fans will be glad to know that Enid (Oklahoma) will remain a trivial curiosity – Enid grew at only 0.8% for the year.
- Albany-Schenectady-Troy has nothing on greater DC, growing at only 1.7% for the year.
- Bismarck, the fastest growing metro area in all of North Dakota, grew at only 1.4% for the year.
- Meanwhile, Boston-Cambridge-Newton added jobs at 4.2% clip, outdone within the region by the greater Portland (Maine) area and its 5.2% growth.
- New York-Newark-Jersey City grew at a 4.3% rate even though it is already quite big.
- Philadelphia-Camden-Wilmington grew at a 3.4% rate even though it includes Camden, NJ.
- Charlotte-Concord-Gastonia grew at a 5.7% rate.
- Los Angeles-Long Beach-Anaheim grew at a 4.5% rate, while the “other LA” (Lewiston-Auburn, Maine) grew at a 2.4% rate.
- San Francisco-Oakland-Hayward grew at a 4.6% rate despite its housing affordability challenges.
- Is Duluth the San Francisco of the Upper Midwest? I do love it up there, and apparently some others do as well, with employment growing at a 2.5% clip…which is just fine at that temperature.
Latest from the Current Employment Statistics
The November 18th release of October CES data included Maryland in the list of “states with unemployment rates significantly different from that of the U.S.” – the U.S. unemployment rate was 3.7% while the Maryland rate was 4.5%. The release further noted: “In October, 24 states had over-the-month unemployment rate increases, the largest of which was in Maryland (+0.5 percentage point).”
The good news from this release is that while Maryland’s recovery from the brief COVID pandemic has slowed considerably, the state still added 5,400 jobs from September to October of 2022 (not seasonally adjusted). The bad news is that September 2022 to October 2022 job growth was significantly slower in Maryland than nationally (0.2% versus 0.8%). Similarly, new data released December 1 at the metropolitan division level shows that employment in the Silver Spring-Frederick-Rockville division grew at a 0.5% clip from September to October of 2022, compared to 0.7% for the Washington-Arlington-Alexandria metropolitan division. Suburban Maryland still appears to be in slo-mo when compared to the region and the nation. Hang in there, folks!